Immigrants from Micronesia vs Immigrants from Western Africa Unemployment Among Seniors over 65 years
COMPARE
Immigrants from Micronesia
Immigrants from Western Africa
Unemployment Among Seniors over 65 years
Unemployment Among Seniors over 65 years Comparison
Immigrants from Micronesia
Immigrants from Western Africa
5.4%
UNEMPLOYMENT AMONG SENIORS OVER 65 YEARS
0.4/ 100
METRIC RATING
257th/ 347
METRIC RANK
5.4%
UNEMPLOYMENT AMONG SENIORS OVER 65 YEARS
0.1/ 100
METRIC RATING
277th/ 347
METRIC RANK
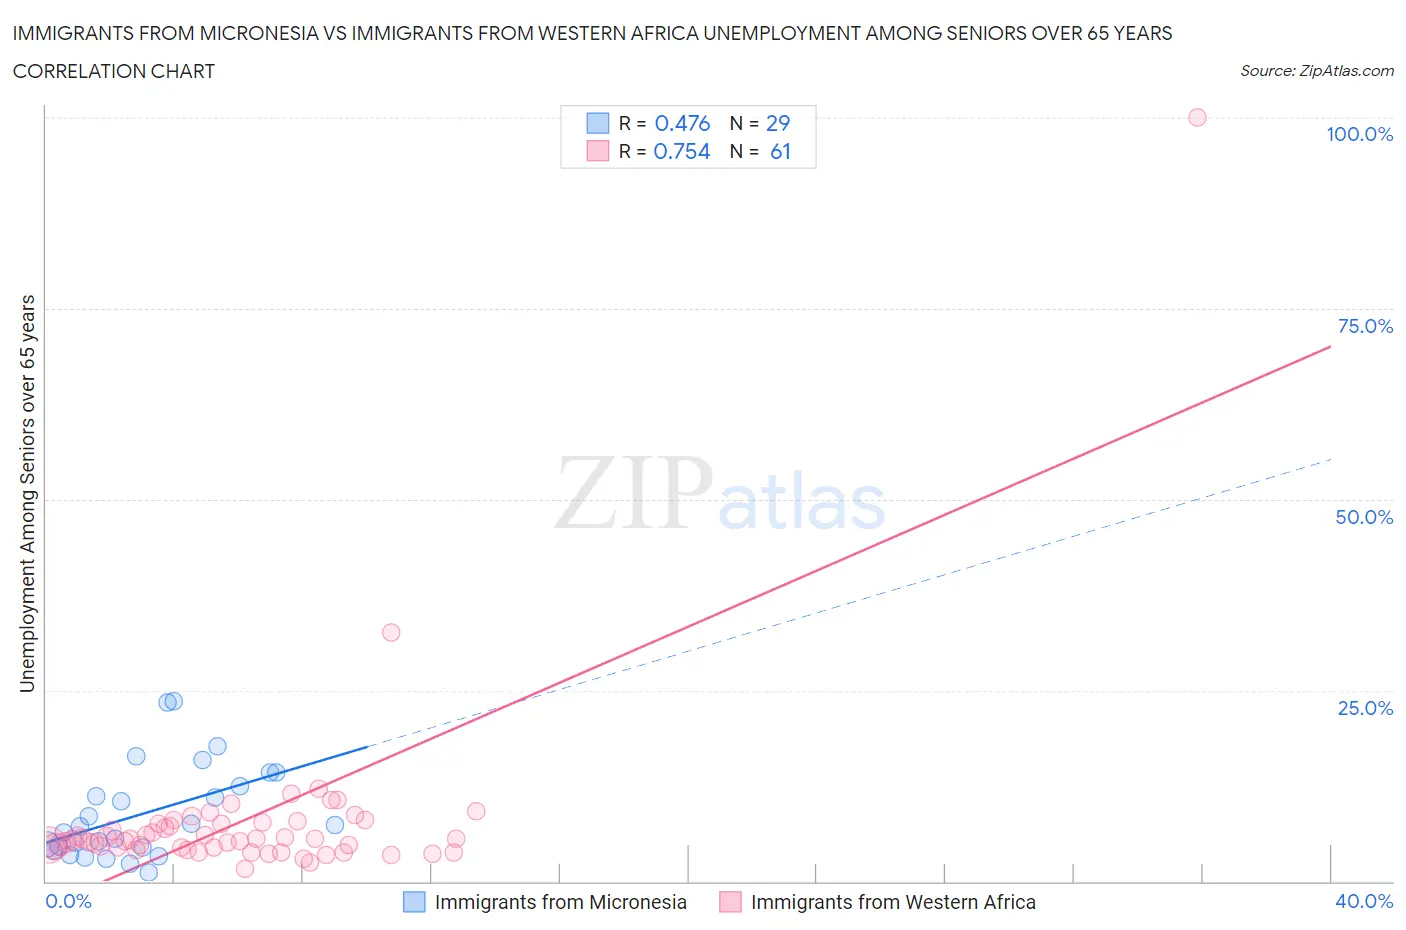
Immigrants from Micronesia vs Immigrants from Western Africa Unemployment Among Seniors over 65 years Correlation Chart
The statistical analysis conducted on geographies consisting of 58,652,475 people shows a moderate positive correlation between the proportion of Immigrants from Micronesia and unemployment rate amomg seniors over the age of 65 in the United States with a correlation coefficient (R) of 0.476 and weighted average of 5.4%. Similarly, the statistical analysis conducted on geographies consisting of 328,534,988 people shows a strong positive correlation between the proportion of Immigrants from Western Africa and unemployment rate amomg seniors over the age of 65 in the United States with a correlation coefficient (R) of 0.754 and weighted average of 5.4%, a difference of 1.3%.
Unemployment Among Seniors over 65 years Correlation Summary
| Measurement | Immigrants from Micronesia | Immigrants from Western Africa |
| Minimum | 1.1% | 1.7% |
| Maximum | 23.6% | 100.0% |
| Range | 22.5% | 98.3% |
| Mean | 8.9% | 7.9% |
| Median | 7.3% | 5.5% |
| Interquartile 25% (IQ1) | 4.3% | 4.5% |
| Interquartile 75% (IQ3) | 13.3% | 7.6% |
| Interquartile Range (IQR) | 9.0% | 3.1% |
| Standard Deviation (Sample) | 6.1% | 12.7% |
| Standard Deviation (Population) | 6.0% | 12.6% |
Demographics Similar to Immigrants from Micronesia and Immigrants from Western Africa by Unemployment Among Seniors over 65 years
In terms of unemployment among seniors over 65 years, the demographic groups most similar to Immigrants from Micronesia are Sierra Leonean (5.4%, a difference of 0.070%), Immigrants from Ghana (5.4%, a difference of 0.15%), Native Hawaiian (5.4%, a difference of 0.37%), Spanish American Indian (5.4%, a difference of 0.45%), and Immigrants from Grenada (5.4%, a difference of 0.52%). Similarly, the demographic groups most similar to Immigrants from Western Africa are Pueblo (5.4%, a difference of 0.030%), Mexican American Indian (5.4%, a difference of 0.060%), Immigrants from Brazil (5.4%, a difference of 0.19%), Immigrants from Nigeria (5.4%, a difference of 0.23%), and Cypriot (5.4%, a difference of 0.24%).
| Demographics | Rating | Rank | Unemployment Among Seniors over 65 years |
| Immigrants | Micronesia | 0.4 /100 | #257 | Tragic 5.4% |
| Sierra Leoneans | 0.4 /100 | #258 | Tragic 5.4% |
| Immigrants | Ghana | 0.4 /100 | #259 | Tragic 5.4% |
| Native Hawaiians | 0.3 /100 | #260 | Tragic 5.4% |
| Spanish American Indians | 0.2 /100 | #261 | Tragic 5.4% |
| Immigrants | Grenada | 0.2 /100 | #262 | Tragic 5.4% |
| South Americans | 0.2 /100 | #263 | Tragic 5.4% |
| Central American Indians | 0.2 /100 | #264 | Tragic 5.4% |
| Immigrants | Colombia | 0.2 /100 | #265 | Tragic 5.4% |
| Pennsylvania Germans | 0.2 /100 | #266 | Tragic 5.4% |
| Chippewa | 0.2 /100 | #267 | Tragic 5.4% |
| Hawaiians | 0.1 /100 | #268 | Tragic 5.4% |
| Immigrants | Southern Europe | 0.1 /100 | #269 | Tragic 5.4% |
| Immigrants | Morocco | 0.1 /100 | #270 | Tragic 5.4% |
| Cypriots | 0.1 /100 | #271 | Tragic 5.4% |
| Immigrants | Jamaica | 0.1 /100 | #272 | Tragic 5.4% |
| Immigrants | Nigeria | 0.1 /100 | #273 | Tragic 5.4% |
| Immigrants | Brazil | 0.1 /100 | #274 | Tragic 5.4% |
| Mexican American Indians | 0.1 /100 | #275 | Tragic 5.4% |
| Pueblo | 0.1 /100 | #276 | Tragic 5.4% |
| Immigrants | Western Africa | 0.1 /100 | #277 | Tragic 5.4% |