Immigrants from Micronesia vs West Indian Unemployment Among Women with Children Under 6 years
COMPARE
Immigrants from Micronesia
West Indian
Unemployment Among Women with Children Under 6 years
Unemployment Among Women with Children Under 6 years Comparison
Immigrants from Micronesia
West Indians
9.1%
UNEMPLOYMENT AMONG WOMEN WITH CHILDREN UNDER 6 YEARS
0.0/ 100
METRIC RATING
308th/ 347
METRIC RANK
8.4%
UNEMPLOYMENT AMONG WOMEN WITH CHILDREN UNDER 6 YEARS
0.3/ 100
METRIC RATING
262nd/ 347
METRIC RANK
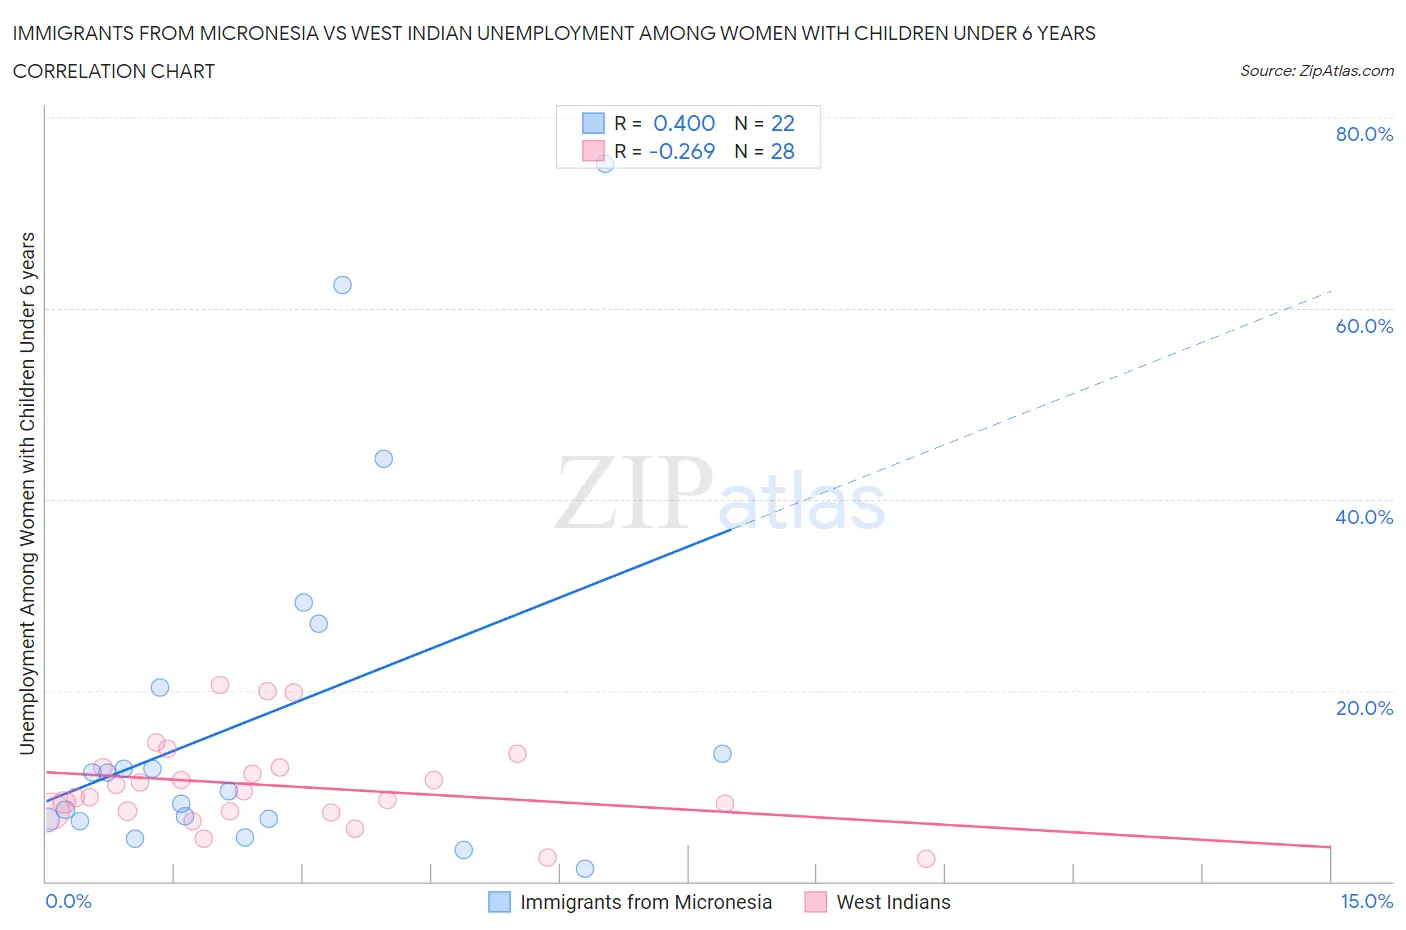
Immigrants from Micronesia vs West Indian Unemployment Among Women with Children Under 6 years Correlation Chart
The statistical analysis conducted on geographies consisting of 56,683,877 people shows a moderate positive correlation between the proportion of Immigrants from Micronesia and unemployment rate among women with children under the age of 6 in the United States with a correlation coefficient (R) of 0.400 and weighted average of 9.1%. Similarly, the statistical analysis conducted on geographies consisting of 210,232,291 people shows a weak negative correlation between the proportion of West Indians and unemployment rate among women with children under the age of 6 in the United States with a correlation coefficient (R) of -0.269 and weighted average of 8.4%, a difference of 8.8%.
Unemployment Among Women with Children Under 6 years Correlation Summary
| Measurement | Immigrants from Micronesia | West Indian |
| Minimum | 1.3% | 2.3% |
| Maximum | 75.2% | 20.6% |
| Range | 73.9% | 18.3% |
| Mean | 17.4% | 10.0% |
| Median | 10.4% | 9.1% |
| Interquartile 25% (IQ1) | 6.4% | 7.3% |
| Interquartile 75% (IQ3) | 20.4% | 11.9% |
| Interquartile Range (IQR) | 14.0% | 4.6% |
| Standard Deviation (Sample) | 19.5% | 4.6% |
| Standard Deviation (Population) | 19.1% | 4.6% |
Similar Demographics by Unemployment Among Women with Children Under 6 years
Demographics Similar to Immigrants from Micronesia by Unemployment Among Women with Children Under 6 years
In terms of unemployment among women with children under 6 years, the demographic groups most similar to Immigrants from Micronesia are Dominican (9.1%, a difference of 0.070%), Pueblo (9.1%, a difference of 0.18%), Alaskan Athabascan (9.1%, a difference of 0.36%), African (9.2%, a difference of 0.39%), and Cajun (9.2%, a difference of 0.53%).
| Demographics | Rating | Rank | Unemployment Among Women with Children Under 6 years |
| Chickasaw | 0.0 /100 | #301 | Tragic 9.0% |
| Hispanics or Latinos | 0.0 /100 | #302 | Tragic 9.0% |
| Immigrants | West Indies | 0.0 /100 | #303 | Tragic 9.0% |
| Immigrants | Mexico | 0.0 /100 | #304 | Tragic 9.1% |
| Alaskan Athabascans | 0.0 /100 | #305 | Tragic 9.1% |
| Pueblo | 0.0 /100 | #306 | Tragic 9.1% |
| Dominicans | 0.0 /100 | #307 | Tragic 9.1% |
| Immigrants | Micronesia | 0.0 /100 | #308 | Tragic 9.1% |
| Africans | 0.0 /100 | #309 | Tragic 9.2% |
| Cajuns | 0.0 /100 | #310 | Tragic 9.2% |
| French American Indians | 0.0 /100 | #311 | Tragic 9.2% |
| Immigrants | Azores | 0.0 /100 | #312 | Tragic 9.2% |
| Americans | 0.0 /100 | #313 | Tragic 9.3% |
| Fijians | 0.0 /100 | #314 | Tragic 9.3% |
| Cherokee | 0.0 /100 | #315 | Tragic 9.3% |
Demographics Similar to West Indians by Unemployment Among Women with Children Under 6 years
In terms of unemployment among women with children under 6 years, the demographic groups most similar to West Indians are Immigrants from Liberia (8.4%, a difference of 0.010%), Scotch-Irish (8.4%, a difference of 0.030%), Honduran (8.4%, a difference of 0.050%), French Canadian (8.4%, a difference of 0.10%), and Immigrants from Honduras (8.4%, a difference of 0.11%).
| Demographics | Rating | Rank | Unemployment Among Women with Children Under 6 years |
| Immigrants | Portugal | 0.6 /100 | #255 | Tragic 8.3% |
| Celtics | 0.6 /100 | #256 | Tragic 8.3% |
| British West Indians | 0.5 /100 | #257 | Tragic 8.3% |
| Immigrants | Ghana | 0.5 /100 | #258 | Tragic 8.3% |
| Barbadians | 0.4 /100 | #259 | Tragic 8.3% |
| Whites/Caucasians | 0.3 /100 | #260 | Tragic 8.4% |
| Immigrants | Liberia | 0.3 /100 | #261 | Tragic 8.4% |
| West Indians | 0.3 /100 | #262 | Tragic 8.4% |
| Scotch-Irish | 0.3 /100 | #263 | Tragic 8.4% |
| Hondurans | 0.3 /100 | #264 | Tragic 8.4% |
| French Canadians | 0.3 /100 | #265 | Tragic 8.4% |
| Immigrants | Honduras | 0.3 /100 | #266 | Tragic 8.4% |
| Belizeans | 0.2 /100 | #267 | Tragic 8.4% |
| Sub-Saharan Africans | 0.2 /100 | #268 | Tragic 8.4% |
| Immigrants | Haiti | 0.2 /100 | #269 | Tragic 8.4% |