Immigrants from Malaysia vs Chippewa Male Unemployment
COMPARE
Immigrants from Malaysia
Chippewa
Male Unemployment
Male Unemployment Comparison
Immigrants from Malaysia
Chippewa
5.2%
MALE UNEMPLOYMENT
83.5/ 100
METRIC RATING
130th/ 347
METRIC RANK
6.6%
MALE UNEMPLOYMENT
0.0/ 100
METRIC RATING
297th/ 347
METRIC RANK
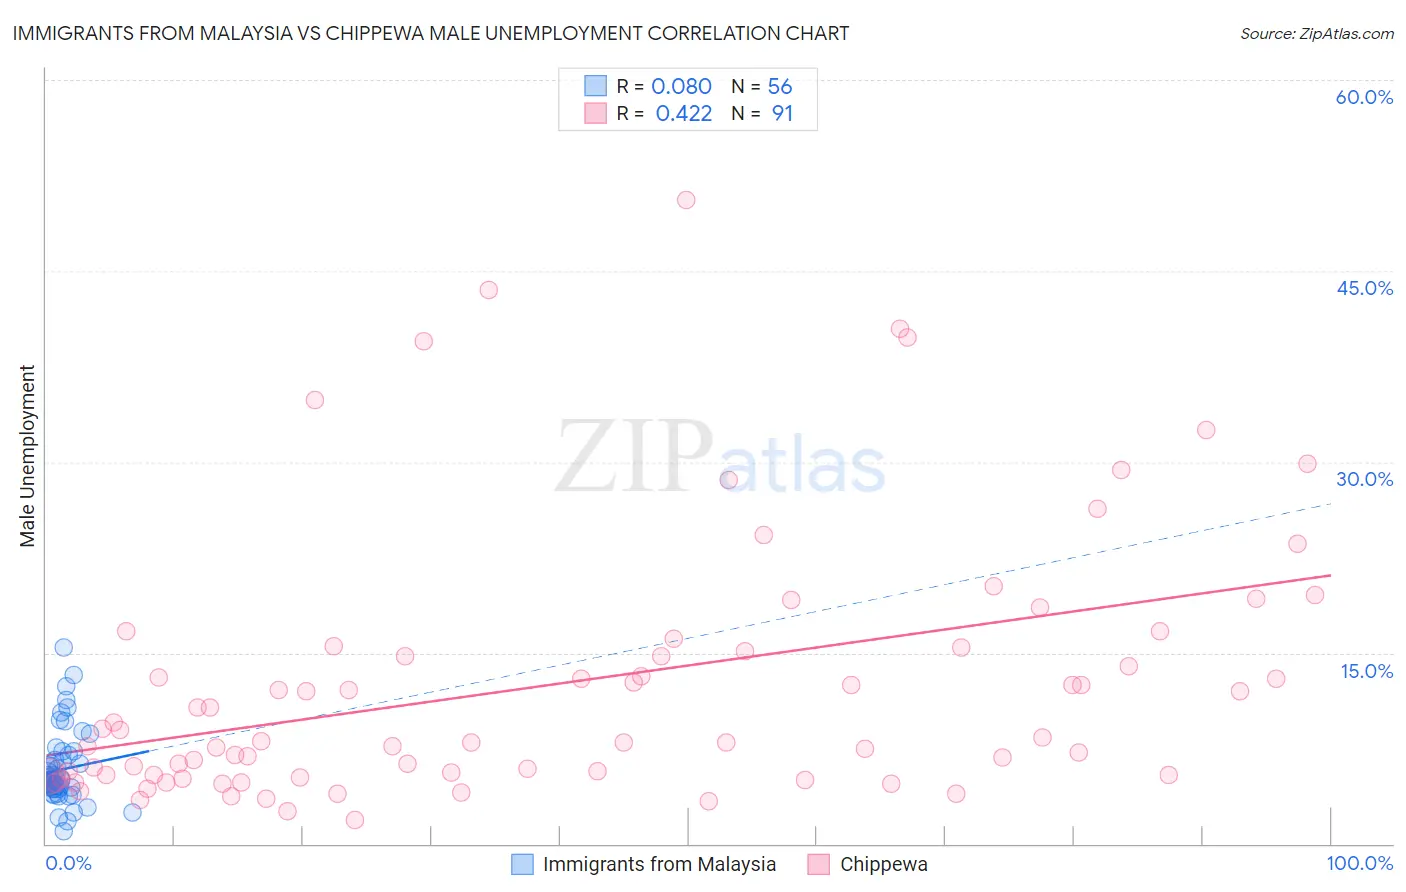
Immigrants from Malaysia vs Chippewa Male Unemployment Correlation Chart
The statistical analysis conducted on geographies consisting of 197,762,289 people shows a slight positive correlation between the proportion of Immigrants from Malaysia and unemployment rate among males in the United States with a correlation coefficient (R) of 0.080 and weighted average of 5.2%. Similarly, the statistical analysis conducted on geographies consisting of 214,243,166 people shows a moderate positive correlation between the proportion of Chippewa and unemployment rate among males in the United States with a correlation coefficient (R) of 0.422 and weighted average of 6.6%, a difference of 26.7%.
Male Unemployment Correlation Summary
| Measurement | Immigrants from Malaysia | Chippewa |
| Minimum | 1.0% | 1.9% |
| Maximum | 15.4% | 50.6% |
| Range | 14.4% | 48.7% |
| Mean | 5.8% | 12.5% |
| Median | 5.0% | 8.0% |
| Interquartile 25% (IQ1) | 4.4% | 5.4% |
| Interquartile 75% (IQ3) | 6.8% | 15.4% |
| Interquartile Range (IQR) | 2.4% | 10.0% |
| Standard Deviation (Sample) | 2.9% | 10.3% |
| Standard Deviation (Population) | 2.9% | 10.3% |
Similar Demographics by Male Unemployment
Demographics Similar to Immigrants from Malaysia by Male Unemployment
In terms of male unemployment, the demographic groups most similar to Immigrants from Malaysia are Immigrants from Germany (5.2%, a difference of 0.050%), Chickasaw (5.2%, a difference of 0.070%), Immigrants from Western Europe (5.2%, a difference of 0.15%), Hungarian (5.2%, a difference of 0.18%), and Colombian (5.2%, a difference of 0.25%).
| Demographics | Rating | Rank | Male Unemployment |
| Palestinians | 87.7 /100 | #123 | Excellent 5.1% |
| Immigrants | Latvia | 87.5 /100 | #124 | Excellent 5.1% |
| Immigrants | Lithuania | 87.2 /100 | #125 | Excellent 5.1% |
| Immigrants | Colombia | 86.8 /100 | #126 | Excellent 5.1% |
| Immigrants | Brazil | 86.3 /100 | #127 | Excellent 5.2% |
| Hungarians | 85.1 /100 | #128 | Excellent 5.2% |
| Immigrants | Western Europe | 84.8 /100 | #129 | Excellent 5.2% |
| Immigrants | Malaysia | 83.5 /100 | #130 | Excellent 5.2% |
| Immigrants | Germany | 83.0 /100 | #131 | Excellent 5.2% |
| Chickasaw | 82.9 /100 | #132 | Excellent 5.2% |
| Colombians | 81.1 /100 | #133 | Excellent 5.2% |
| Pakistanis | 80.5 /100 | #134 | Excellent 5.2% |
| Immigrants | Saudi Arabia | 80.1 /100 | #135 | Excellent 5.2% |
| Lebanese | 79.9 /100 | #136 | Good 5.2% |
| Immigrants | Eastern Africa | 79.8 /100 | #137 | Good 5.2% |
Demographics Similar to Chippewa by Male Unemployment
In terms of male unemployment, the demographic groups most similar to Chippewa are Jamaican (6.6%, a difference of 0.080%), Immigrants from Bangladesh (6.6%, a difference of 0.21%), Immigrants from Haiti (6.5%, a difference of 0.32%), Vietnamese (6.6%, a difference of 0.48%), and Immigrants from Belize (6.6%, a difference of 0.58%).
| Demographics | Rating | Rank | Male Unemployment |
| U.S. Virgin Islanders | 0.0 /100 | #290 | Tragic 6.4% |
| Immigrants | Azores | 0.0 /100 | #291 | Tragic 6.4% |
| Nepalese | 0.0 /100 | #292 | Tragic 6.4% |
| Haitians | 0.0 /100 | #293 | Tragic 6.4% |
| Senegalese | 0.0 /100 | #294 | Tragic 6.4% |
| Belizeans | 0.0 /100 | #295 | Tragic 6.5% |
| Immigrants | Haiti | 0.0 /100 | #296 | Tragic 6.5% |
| Chippewa | 0.0 /100 | #297 | Tragic 6.6% |
| Jamaicans | 0.0 /100 | #298 | Tragic 6.6% |
| Immigrants | Bangladesh | 0.0 /100 | #299 | Tragic 6.6% |
| Vietnamese | 0.0 /100 | #300 | Tragic 6.6% |
| Immigrants | Belize | 0.0 /100 | #301 | Tragic 6.6% |
| Ute | 0.0 /100 | #302 | Tragic 6.6% |
| Immigrants | West Indies | 0.0 /100 | #303 | Tragic 6.7% |
| West Indians | 0.0 /100 | #304 | Tragic 6.7% |