Immigrants from Malaysia vs Immigrants from Trinidad and Tobago Unemployment
COMPARE
Immigrants from Malaysia
Immigrants from Trinidad and Tobago
Unemployment
Unemployment Comparison
Immigrants from Malaysia
Immigrants from Trinidad and Tobago
5.1%
UNEMPLOYMENT
91.0/ 100
METRIC RATING
117th/ 347
METRIC RANK
6.3%
UNEMPLOYMENT
0.0/ 100
METRIC RATING
300th/ 347
METRIC RANK
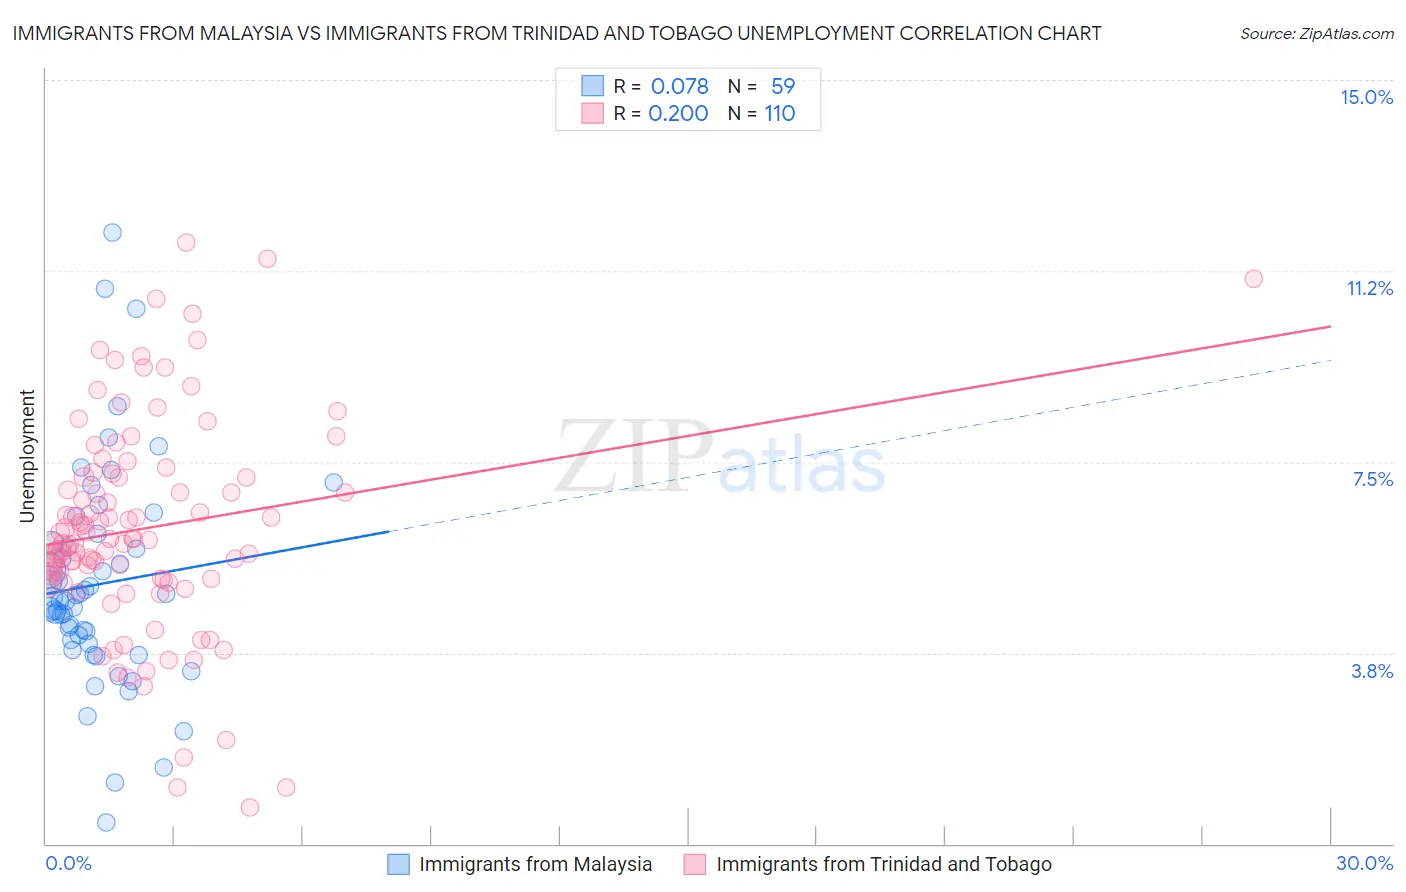
Immigrants from Malaysia vs Immigrants from Trinidad and Tobago Unemployment Correlation Chart
The statistical analysis conducted on geographies consisting of 197,947,224 people shows a slight positive correlation between the proportion of Immigrants from Malaysia and unemployment in the United States with a correlation coefficient (R) of 0.078 and weighted average of 5.1%. Similarly, the statistical analysis conducted on geographies consisting of 223,333,177 people shows a weak positive correlation between the proportion of Immigrants from Trinidad and Tobago and unemployment in the United States with a correlation coefficient (R) of 0.200 and weighted average of 6.3%, a difference of 24.5%.
Unemployment Correlation Summary
| Measurement | Immigrants from Malaysia | Immigrants from Trinidad and Tobago |
| Minimum | 0.41% | 0.70% |
| Maximum | 12.0% | 11.8% |
| Range | 11.6% | 11.1% |
| Mean | 5.1% | 6.2% |
| Median | 4.8% | 6.0% |
| Interquartile 25% (IQ1) | 3.9% | 5.2% |
| Interquartile 75% (IQ3) | 5.9% | 7.2% |
| Interquartile Range (IQR) | 2.0% | 2.0% |
| Standard Deviation (Sample) | 2.1% | 2.1% |
| Standard Deviation (Population) | 2.1% | 2.1% |
Similar Demographics by Unemployment
Demographics Similar to Immigrants from Malaysia by Unemployment
In terms of unemployment, the demographic groups most similar to Immigrants from Malaysia are Immigrants from Sri Lanka (5.1%, a difference of 0.020%), Immigrants from Western Europe (5.1%, a difference of 0.030%), Immigrants from Germany (5.1%, a difference of 0.040%), Immigrants from Ireland (5.1%, a difference of 0.24%), and Immigrants from France (5.1%, a difference of 0.24%).
| Demographics | Rating | Rank | Unemployment |
| Immigrants | Lithuania | 93.2 /100 | #110 | Exceptional 5.0% |
| Chileans | 93.2 /100 | #111 | Exceptional 5.0% |
| South Africans | 92.6 /100 | #112 | Exceptional 5.1% |
| Argentineans | 92.4 /100 | #113 | Exceptional 5.1% |
| Immigrants | Ireland | 92.1 /100 | #114 | Exceptional 5.1% |
| Immigrants | Western Europe | 91.1 /100 | #115 | Exceptional 5.1% |
| Immigrants | Sri Lanka | 91.1 /100 | #116 | Exceptional 5.1% |
| Immigrants | Malaysia | 91.0 /100 | #117 | Exceptional 5.1% |
| Immigrants | Germany | 90.8 /100 | #118 | Exceptional 5.1% |
| Immigrants | France | 89.7 /100 | #119 | Excellent 5.1% |
| Macedonians | 89.7 /100 | #120 | Excellent 5.1% |
| Lebanese | 89.2 /100 | #121 | Excellent 5.1% |
| Immigrants | Switzerland | 89.1 /100 | #122 | Excellent 5.1% |
| Asians | 89.0 /100 | #123 | Excellent 5.1% |
| Ethiopians | 88.6 /100 | #124 | Excellent 5.1% |
Demographics Similar to Immigrants from Trinidad and Tobago by Unemployment
In terms of unemployment, the demographic groups most similar to Immigrants from Trinidad and Tobago are Immigrants from West Indies (6.3%, a difference of 0.12%), Immigrants from Haiti (6.3%, a difference of 0.17%), Jamaican (6.3%, a difference of 0.26%), Trinidadian and Tobagonian (6.3%, a difference of 0.48%), and Ute (6.3%, a difference of 0.60%).
| Demographics | Rating | Rank | Unemployment |
| Immigrants | Ecuador | 0.0 /100 | #293 | Tragic 6.2% |
| Spanish American Indians | 0.0 /100 | #294 | Tragic 6.2% |
| U.S. Virgin Islanders | 0.0 /100 | #295 | Tragic 6.3% |
| Ute | 0.0 /100 | #296 | Tragic 6.3% |
| Jamaicans | 0.0 /100 | #297 | Tragic 6.3% |
| Immigrants | Haiti | 0.0 /100 | #298 | Tragic 6.3% |
| Immigrants | West Indies | 0.0 /100 | #299 | Tragic 6.3% |
| Immigrants | Trinidad and Tobago | 0.0 /100 | #300 | Tragic 6.3% |
| Trinidadians and Tobagonians | 0.0 /100 | #301 | Tragic 6.3% |
| West Indians | 0.0 /100 | #302 | Tragic 6.4% |
| Belizeans | 0.0 /100 | #303 | Tragic 6.4% |
| Immigrants | Jamaica | 0.0 /100 | #304 | Tragic 6.4% |
| Menominee | 0.0 /100 | #305 | Tragic 6.4% |
| Lumbee | 0.0 /100 | #306 | Tragic 6.4% |
| Immigrants | Bangladesh | 0.0 /100 | #307 | Tragic 6.5% |