Immigrants from Western Asia vs Immigrants from Trinidad and Tobago Unemployment
COMPARE
Immigrants from Western Asia
Immigrants from Trinidad and Tobago
Unemployment
Unemployment Comparison
Immigrants from Western Asia
Immigrants from Trinidad and Tobago
5.5%
UNEMPLOYMENT
2.8/ 100
METRIC RATING
238th/ 347
METRIC RANK
6.3%
UNEMPLOYMENT
0.0/ 100
METRIC RATING
300th/ 347
METRIC RANK
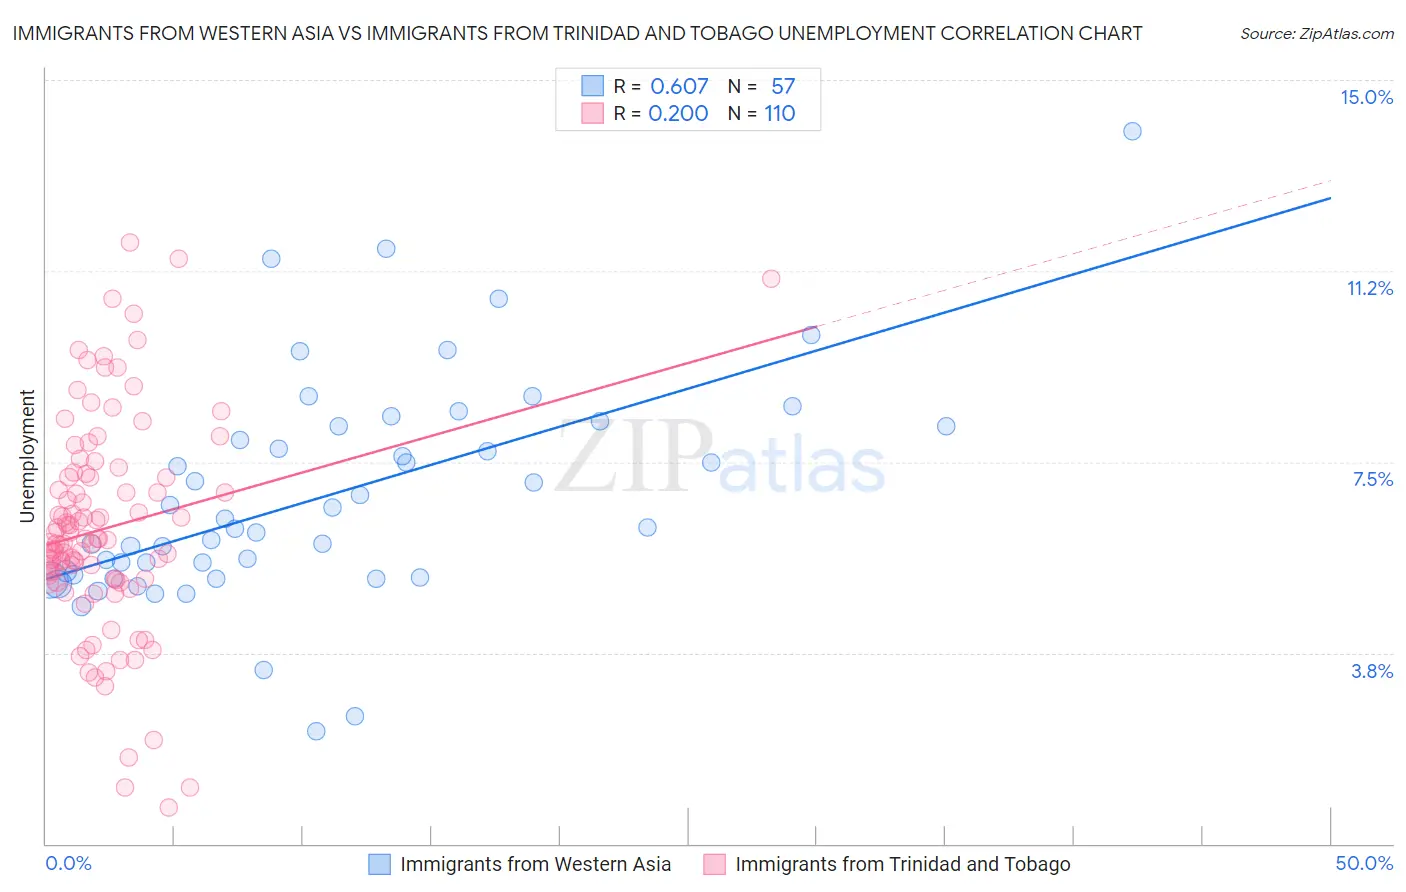
Immigrants from Western Asia vs Immigrants from Trinidad and Tobago Unemployment Correlation Chart
The statistical analysis conducted on geographies consisting of 404,185,232 people shows a significant positive correlation between the proportion of Immigrants from Western Asia and unemployment in the United States with a correlation coefficient (R) of 0.607 and weighted average of 5.5%. Similarly, the statistical analysis conducted on geographies consisting of 223,333,177 people shows a weak positive correlation between the proportion of Immigrants from Trinidad and Tobago and unemployment in the United States with a correlation coefficient (R) of 0.200 and weighted average of 6.3%, a difference of 13.9%.
Unemployment Correlation Summary
| Measurement | Immigrants from Western Asia | Immigrants from Trinidad and Tobago |
| Minimum | 2.2% | 0.70% |
| Maximum | 14.0% | 11.8% |
| Range | 11.8% | 11.1% |
| Mean | 6.8% | 6.2% |
| Median | 6.2% | 6.0% |
| Interquartile 25% (IQ1) | 5.3% | 5.2% |
| Interquartile 75% (IQ3) | 8.2% | 7.2% |
| Interquartile Range (IQR) | 2.9% | 2.0% |
| Standard Deviation (Sample) | 2.2% | 2.1% |
| Standard Deviation (Population) | 2.2% | 2.1% |
Similar Demographics by Unemployment
Demographics Similar to Immigrants from Western Asia by Unemployment
In terms of unemployment, the demographic groups most similar to Immigrants from Western Asia are Immigrants (5.5%, a difference of 0.090%), Cree (5.6%, a difference of 0.10%), Moroccan (5.5%, a difference of 0.21%), Immigrants from Cambodia (5.5%, a difference of 0.27%), and Immigrants from Panama (5.5%, a difference of 0.30%).
| Demographics | Rating | Rank | Unemployment |
| Immigrants | Africa | 4.9 /100 | #231 | Tragic 5.5% |
| Comanche | 4.9 /100 | #232 | Tragic 5.5% |
| Immigrants | Syria | 4.8 /100 | #233 | Tragic 5.5% |
| Panamanians | 4.7 /100 | #234 | Tragic 5.5% |
| Immigrants | Panama | 3.4 /100 | #235 | Tragic 5.5% |
| Immigrants | Cambodia | 3.3 /100 | #236 | Tragic 5.5% |
| Moroccans | 3.2 /100 | #237 | Tragic 5.5% |
| Immigrants | Western Asia | 2.8 /100 | #238 | Tragic 5.5% |
| Immigrants | Immigrants | 2.6 /100 | #239 | Tragic 5.5% |
| Cree | 2.6 /100 | #240 | Tragic 5.6% |
| Tlingit-Haida | 2.0 /100 | #241 | Tragic 5.6% |
| Spanish Americans | 2.0 /100 | #242 | Tragic 5.6% |
| Marshallese | 1.3 /100 | #243 | Tragic 5.6% |
| Dutch West Indians | 1.2 /100 | #244 | Tragic 5.6% |
| French American Indians | 1.2 /100 | #245 | Tragic 5.6% |
Demographics Similar to Immigrants from Trinidad and Tobago by Unemployment
In terms of unemployment, the demographic groups most similar to Immigrants from Trinidad and Tobago are Immigrants from West Indies (6.3%, a difference of 0.12%), Immigrants from Haiti (6.3%, a difference of 0.17%), Jamaican (6.3%, a difference of 0.26%), Trinidadian and Tobagonian (6.3%, a difference of 0.48%), and Ute (6.3%, a difference of 0.60%).
| Demographics | Rating | Rank | Unemployment |
| Immigrants | Ecuador | 0.0 /100 | #293 | Tragic 6.2% |
| Spanish American Indians | 0.0 /100 | #294 | Tragic 6.2% |
| U.S. Virgin Islanders | 0.0 /100 | #295 | Tragic 6.3% |
| Ute | 0.0 /100 | #296 | Tragic 6.3% |
| Jamaicans | 0.0 /100 | #297 | Tragic 6.3% |
| Immigrants | Haiti | 0.0 /100 | #298 | Tragic 6.3% |
| Immigrants | West Indies | 0.0 /100 | #299 | Tragic 6.3% |
| Immigrants | Trinidad and Tobago | 0.0 /100 | #300 | Tragic 6.3% |
| Trinidadians and Tobagonians | 0.0 /100 | #301 | Tragic 6.3% |
| West Indians | 0.0 /100 | #302 | Tragic 6.4% |
| Belizeans | 0.0 /100 | #303 | Tragic 6.4% |
| Immigrants | Jamaica | 0.0 /100 | #304 | Tragic 6.4% |
| Menominee | 0.0 /100 | #305 | Tragic 6.4% |
| Lumbee | 0.0 /100 | #306 | Tragic 6.4% |
| Immigrants | Bangladesh | 0.0 /100 | #307 | Tragic 6.5% |