Immigrants from Malaysia vs French American Indian Unemployment
COMPARE
Immigrants from Malaysia
French American Indian
Unemployment
Unemployment Comparison
Immigrants from Malaysia
French American Indians
5.1%
UNEMPLOYMENT
91.0/ 100
METRIC RATING
117th/ 347
METRIC RANK
5.6%
UNEMPLOYMENT
1.2/ 100
METRIC RATING
245th/ 347
METRIC RANK
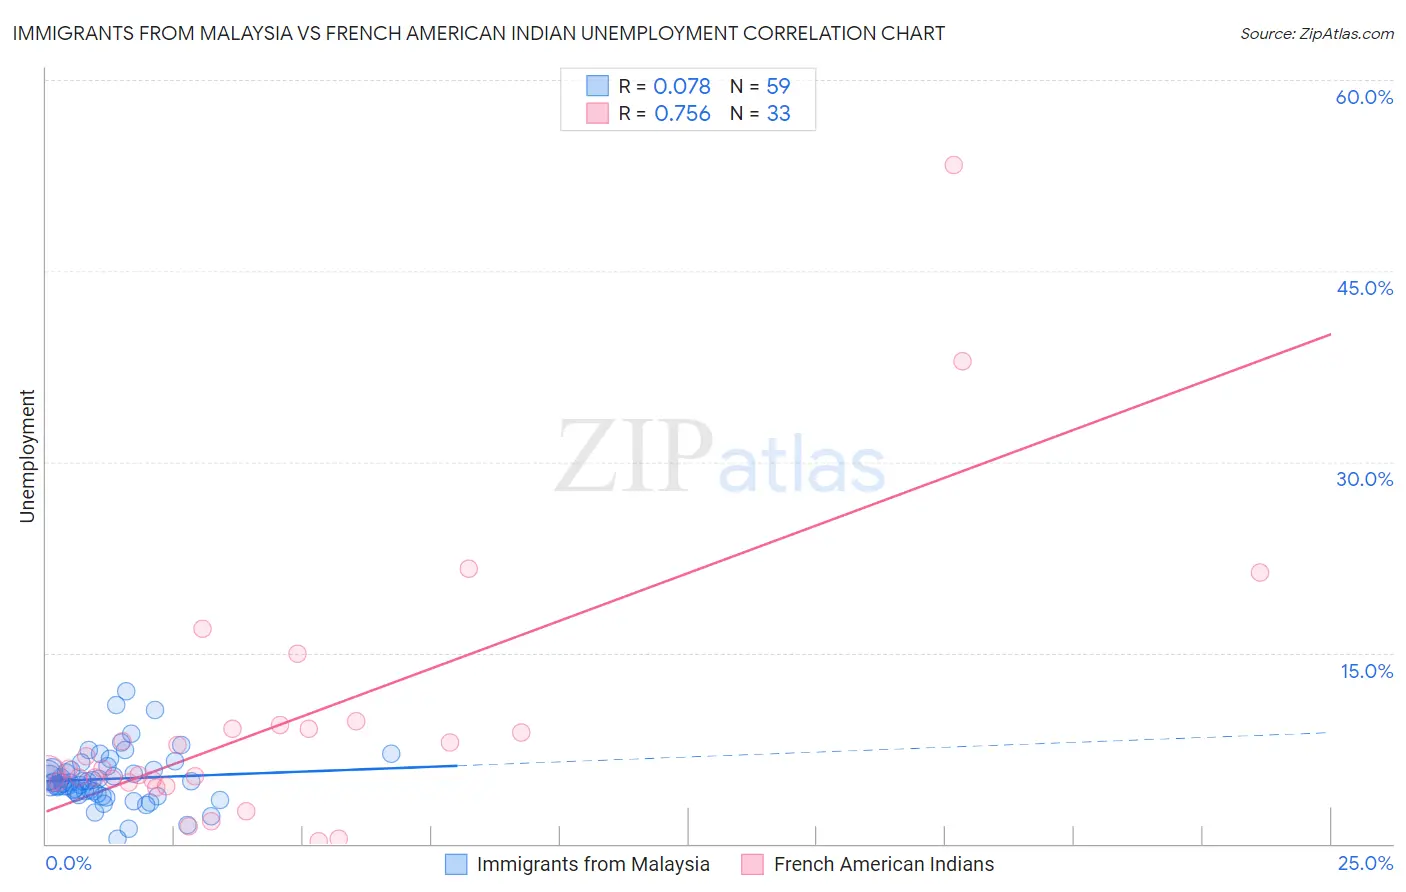
Immigrants from Malaysia vs French American Indian Unemployment Correlation Chart
The statistical analysis conducted on geographies consisting of 197,947,224 people shows a slight positive correlation between the proportion of Immigrants from Malaysia and unemployment in the United States with a correlation coefficient (R) of 0.078 and weighted average of 5.1%. Similarly, the statistical analysis conducted on geographies consisting of 131,873,130 people shows a strong positive correlation between the proportion of French American Indians and unemployment in the United States with a correlation coefficient (R) of 0.756 and weighted average of 5.6%, a difference of 10.7%.
Unemployment Correlation Summary
| Measurement | Immigrants from Malaysia | French American Indian |
| Minimum | 0.41% | 0.20% |
| Maximum | 12.0% | 53.3% |
| Range | 11.6% | 53.1% |
| Mean | 5.1% | 9.6% |
| Median | 4.8% | 5.9% |
| Interquartile 25% (IQ1) | 3.9% | 4.8% |
| Interquartile 75% (IQ3) | 5.9% | 9.2% |
| Interquartile Range (IQR) | 2.0% | 4.4% |
| Standard Deviation (Sample) | 2.1% | 10.8% |
| Standard Deviation (Population) | 2.1% | 10.6% |
Similar Demographics by Unemployment
Demographics Similar to Immigrants from Malaysia by Unemployment
In terms of unemployment, the demographic groups most similar to Immigrants from Malaysia are Immigrants from Sri Lanka (5.1%, a difference of 0.020%), Immigrants from Western Europe (5.1%, a difference of 0.030%), Immigrants from Germany (5.1%, a difference of 0.040%), Immigrants from Ireland (5.1%, a difference of 0.24%), and Immigrants from France (5.1%, a difference of 0.24%).
| Demographics | Rating | Rank | Unemployment |
| Immigrants | Lithuania | 93.2 /100 | #110 | Exceptional 5.0% |
| Chileans | 93.2 /100 | #111 | Exceptional 5.0% |
| South Africans | 92.6 /100 | #112 | Exceptional 5.1% |
| Argentineans | 92.4 /100 | #113 | Exceptional 5.1% |
| Immigrants | Ireland | 92.1 /100 | #114 | Exceptional 5.1% |
| Immigrants | Western Europe | 91.1 /100 | #115 | Exceptional 5.1% |
| Immigrants | Sri Lanka | 91.1 /100 | #116 | Exceptional 5.1% |
| Immigrants | Malaysia | 91.0 /100 | #117 | Exceptional 5.1% |
| Immigrants | Germany | 90.8 /100 | #118 | Exceptional 5.1% |
| Immigrants | France | 89.7 /100 | #119 | Excellent 5.1% |
| Macedonians | 89.7 /100 | #120 | Excellent 5.1% |
| Lebanese | 89.2 /100 | #121 | Excellent 5.1% |
| Immigrants | Switzerland | 89.1 /100 | #122 | Excellent 5.1% |
| Asians | 89.0 /100 | #123 | Excellent 5.1% |
| Ethiopians | 88.6 /100 | #124 | Excellent 5.1% |
Demographics Similar to French American Indians by Unemployment
In terms of unemployment, the demographic groups most similar to French American Indians are Dutch West Indian (5.6%, a difference of 0.020%), Bermudan (5.6%, a difference of 0.050%), Marshallese (5.6%, a difference of 0.17%), Immigrants from Cameroon (5.6%, a difference of 0.19%), and Liberian (5.6%, a difference of 0.32%).
| Demographics | Rating | Rank | Unemployment |
| Immigrants | Western Asia | 2.8 /100 | #238 | Tragic 5.5% |
| Immigrants | Immigrants | 2.6 /100 | #239 | Tragic 5.5% |
| Cree | 2.6 /100 | #240 | Tragic 5.6% |
| Tlingit-Haida | 2.0 /100 | #241 | Tragic 5.6% |
| Spanish Americans | 2.0 /100 | #242 | Tragic 5.6% |
| Marshallese | 1.3 /100 | #243 | Tragic 5.6% |
| Dutch West Indians | 1.2 /100 | #244 | Tragic 5.6% |
| French American Indians | 1.2 /100 | #245 | Tragic 5.6% |
| Bermudans | 1.1 /100 | #246 | Tragic 5.6% |
| Immigrants | Cameroon | 1.0 /100 | #247 | Tragic 5.6% |
| Liberians | 0.9 /100 | #248 | Tragic 5.6% |
| Cajuns | 0.8 /100 | #249 | Tragic 5.6% |
| Japanese | 0.8 /100 | #250 | Tragic 5.6% |
| Kiowa | 0.6 /100 | #251 | Tragic 5.7% |
| Hondurans | 0.3 /100 | #252 | Tragic 5.7% |