Immigrants from Malaysia vs Dutch West Indian Unemployment Among Women with Children Under 6 years
COMPARE
Immigrants from Malaysia
Dutch West Indian
Unemployment Among Women with Children Under 6 years
Unemployment Among Women with Children Under 6 years Comparison
Immigrants from Malaysia
Dutch West Indians
6.4%
UNEMPLOYMENT AMONG WOMEN WITH CHILDREN UNDER 6 YEARS
100.0/ 100
METRIC RATING
17th/ 347
METRIC RANK
9.5%
UNEMPLOYMENT AMONG WOMEN WITH CHILDREN UNDER 6 YEARS
0.0/ 100
METRIC RATING
317th/ 347
METRIC RANK
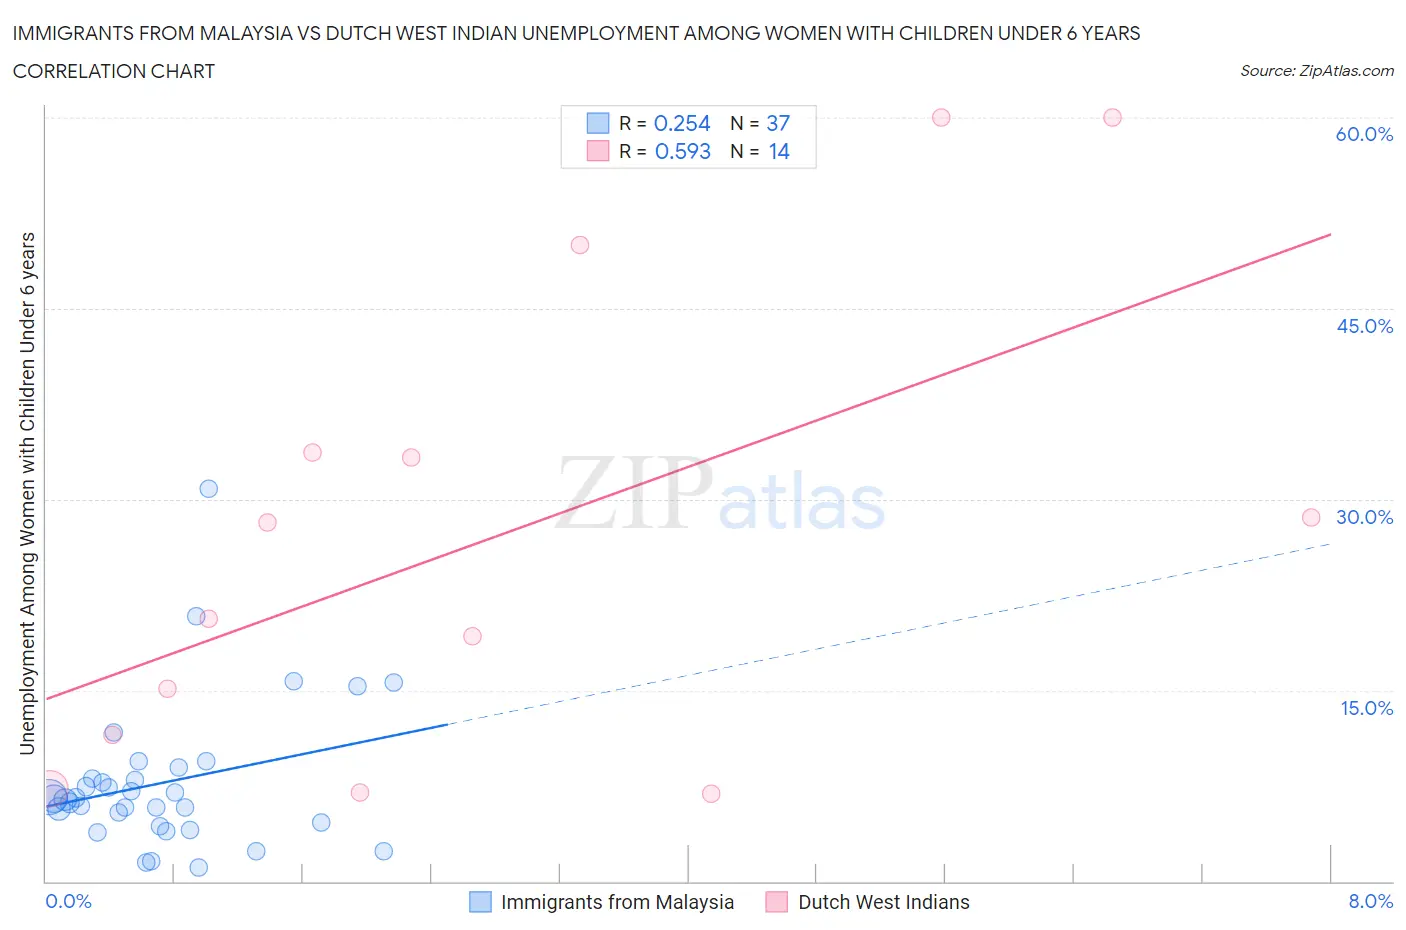
Immigrants from Malaysia vs Dutch West Indian Unemployment Among Women with Children Under 6 years Correlation Chart
The statistical analysis conducted on geographies consisting of 169,871,997 people shows a weak positive correlation between the proportion of Immigrants from Malaysia and unemployment rate among women with children under the age of 6 in the United States with a correlation coefficient (R) of 0.254 and weighted average of 6.4%. Similarly, the statistical analysis conducted on geographies consisting of 76,130,897 people shows a substantial positive correlation between the proportion of Dutch West Indians and unemployment rate among women with children under the age of 6 in the United States with a correlation coefficient (R) of 0.593 and weighted average of 9.5%, a difference of 48.3%.
Unemployment Among Women with Children Under 6 years Correlation Summary
| Measurement | Immigrants from Malaysia | Dutch West Indian |
| Minimum | 1.1% | 6.9% |
| Maximum | 30.8% | 60.0% |
| Range | 29.7% | 53.1% |
| Mean | 7.7% | 27.2% |
| Median | 6.5% | 24.4% |
| Interquartile 25% (IQ1) | 4.5% | 11.5% |
| Interquartile 75% (IQ3) | 8.5% | 33.7% |
| Interquartile Range (IQR) | 4.1% | 22.2% |
| Standard Deviation (Sample) | 5.7% | 18.5% |
| Standard Deviation (Population) | 5.7% | 17.9% |
Similar Demographics by Unemployment Among Women with Children Under 6 years
Demographics Similar to Immigrants from Malaysia by Unemployment Among Women with Children Under 6 years
In terms of unemployment among women with children under 6 years, the demographic groups most similar to Immigrants from Malaysia are Immigrants from Uzbekistan (6.3%, a difference of 0.67%), Thai (6.3%, a difference of 0.97%), Assyrian/Chaldean/Syriac (6.5%, a difference of 0.98%), Immigrants from Bulgaria (6.3%, a difference of 1.1%), and Mongolian (6.5%, a difference of 1.3%).
| Demographics | Rating | Rank | Unemployment Among Women with Children Under 6 years |
| Immigrants | China | 100.0 /100 | #10 | Exceptional 6.2% |
| Indians (Asian) | 100.0 /100 | #11 | Exceptional 6.3% |
| Immigrants | Singapore | 100.0 /100 | #12 | Exceptional 6.3% |
| Immigrants | Eastern Asia | 100.0 /100 | #13 | Exceptional 6.3% |
| Immigrants | Bulgaria | 100.0 /100 | #14 | Exceptional 6.3% |
| Thais | 100.0 /100 | #15 | Exceptional 6.3% |
| Immigrants | Uzbekistan | 100.0 /100 | #16 | Exceptional 6.3% |
| Immigrants | Malaysia | 100.0 /100 | #17 | Exceptional 6.4% |
| Assyrians/Chaldeans/Syriacs | 100.0 /100 | #18 | Exceptional 6.5% |
| Mongolians | 100.0 /100 | #19 | Exceptional 6.5% |
| Ute | 100.0 /100 | #20 | Exceptional 6.5% |
| Burmese | 100.0 /100 | #21 | Exceptional 6.5% |
| Immigrants | Korea | 100.0 /100 | #22 | Exceptional 6.5% |
| Bulgarians | 100.0 /100 | #23 | Exceptional 6.5% |
| Laotians | 100.0 /100 | #24 | Exceptional 6.5% |
Demographics Similar to Dutch West Indians by Unemployment Among Women with Children Under 6 years
In terms of unemployment among women with children under 6 years, the demographic groups most similar to Dutch West Indians are Osage (9.5%, a difference of 0.060%), Houma (9.4%, a difference of 0.79%), Marshallese (9.6%, a difference of 1.1%), Potawatomi (9.6%, a difference of 1.1%), and Central American Indian (9.6%, a difference of 1.2%).
| Demographics | Rating | Rank | Unemployment Among Women with Children Under 6 years |
| Cajuns | 0.0 /100 | #310 | Tragic 9.2% |
| French American Indians | 0.0 /100 | #311 | Tragic 9.2% |
| Immigrants | Azores | 0.0 /100 | #312 | Tragic 9.2% |
| Americans | 0.0 /100 | #313 | Tragic 9.3% |
| Fijians | 0.0 /100 | #314 | Tragic 9.3% |
| Cherokee | 0.0 /100 | #315 | Tragic 9.3% |
| Houma | 0.0 /100 | #316 | Tragic 9.4% |
| Dutch West Indians | 0.0 /100 | #317 | Tragic 9.5% |
| Osage | 0.0 /100 | #318 | Tragic 9.5% |
| Marshallese | 0.0 /100 | #319 | Tragic 9.6% |
| Potawatomi | 0.0 /100 | #320 | Tragic 9.6% |
| Central American Indians | 0.0 /100 | #321 | Tragic 9.6% |
| Alaska Natives | 0.0 /100 | #322 | Tragic 9.6% |
| Immigrants | Bahamas | 0.0 /100 | #323 | Tragic 9.6% |
| Paiute | 0.0 /100 | #324 | Tragic 9.7% |