Jamaican vs Dutch West Indian Unemployment Among Women with Children Under 6 years
COMPARE
Jamaican
Dutch West Indian
Unemployment Among Women with Children Under 6 years
Unemployment Among Women with Children Under 6 years Comparison
Jamaicans
Dutch West Indians
8.8%
UNEMPLOYMENT AMONG WOMEN WITH CHILDREN UNDER 6 YEARS
0.0/ 100
METRIC RATING
291st/ 347
METRIC RANK
9.5%
UNEMPLOYMENT AMONG WOMEN WITH CHILDREN UNDER 6 YEARS
0.0/ 100
METRIC RATING
317th/ 347
METRIC RANK
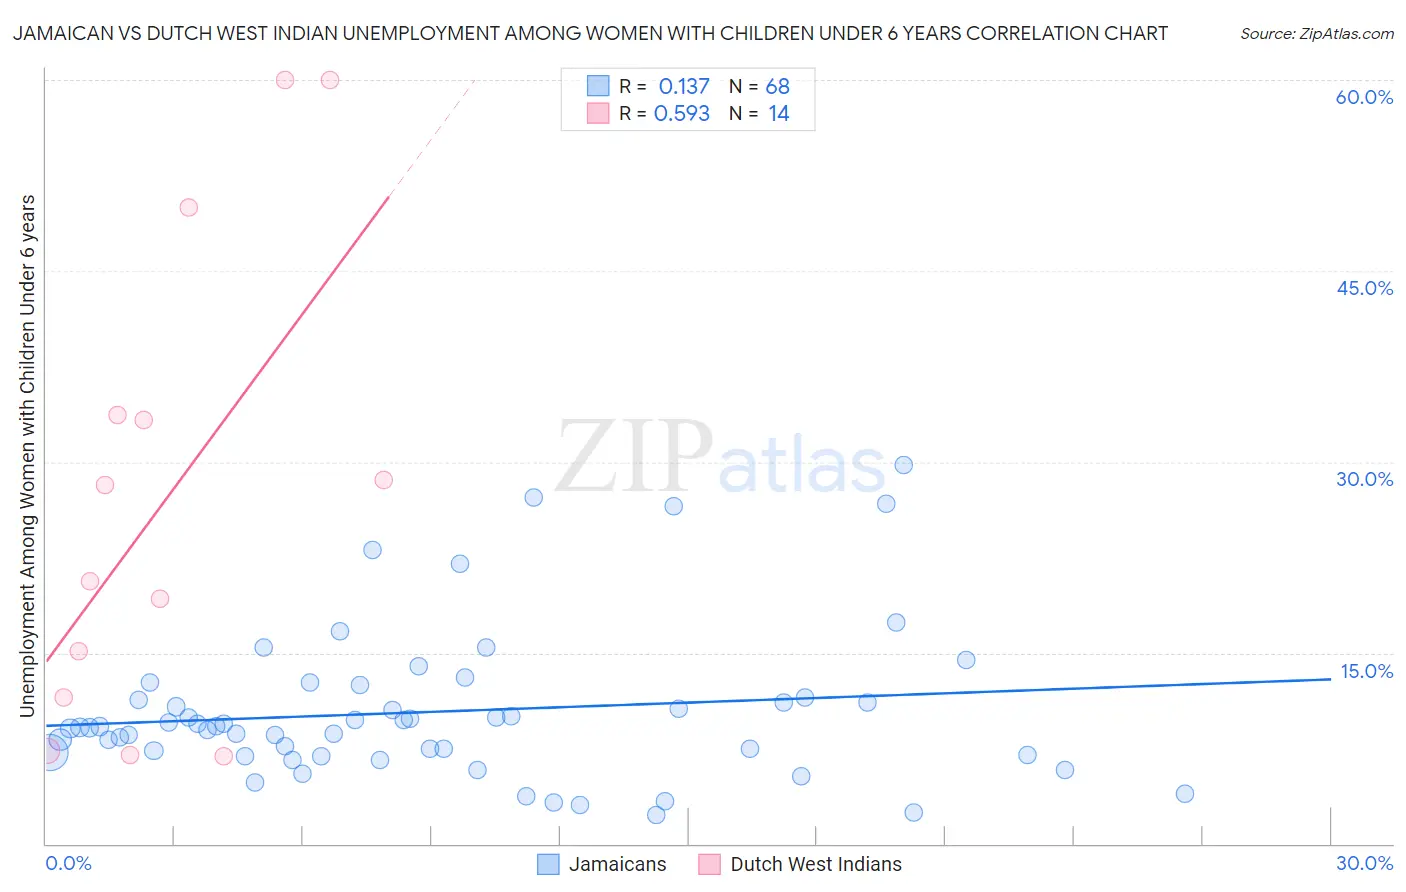
Jamaican vs Dutch West Indian Unemployment Among Women with Children Under 6 years Correlation Chart
The statistical analysis conducted on geographies consisting of 287,606,007 people shows a poor positive correlation between the proportion of Jamaicans and unemployment rate among women with children under the age of 6 in the United States with a correlation coefficient (R) of 0.137 and weighted average of 8.8%. Similarly, the statistical analysis conducted on geographies consisting of 76,130,897 people shows a substantial positive correlation between the proportion of Dutch West Indians and unemployment rate among women with children under the age of 6 in the United States with a correlation coefficient (R) of 0.593 and weighted average of 9.5%, a difference of 7.8%.
Unemployment Among Women with Children Under 6 years Correlation Summary
| Measurement | Jamaican | Dutch West Indian |
| Minimum | 2.3% | 6.9% |
| Maximum | 29.8% | 60.0% |
| Range | 27.5% | 53.1% |
| Mean | 10.4% | 27.2% |
| Median | 9.1% | 24.4% |
| Interquartile 25% (IQ1) | 7.1% | 11.5% |
| Interquartile 75% (IQ3) | 11.4% | 33.7% |
| Interquartile Range (IQR) | 4.3% | 22.2% |
| Standard Deviation (Sample) | 5.9% | 18.5% |
| Standard Deviation (Population) | 5.8% | 17.9% |
Similar Demographics by Unemployment Among Women with Children Under 6 years
Demographics Similar to Jamaicans by Unemployment Among Women with Children Under 6 years
In terms of unemployment among women with children under 6 years, the demographic groups most similar to Jamaicans are Cheyenne (8.8%, a difference of 0.25%), Vietnamese (8.8%, a difference of 0.44%), Immigrants from Bangladesh (8.8%, a difference of 0.48%), Iroquois (8.7%, a difference of 0.59%), and Nonimmigrants (8.8%, a difference of 0.67%).
| Demographics | Rating | Rank | Unemployment Among Women with Children Under 6 years |
| Blackfeet | 0.0 /100 | #284 | Tragic 8.7% |
| U.S. Virgin Islanders | 0.0 /100 | #285 | Tragic 8.7% |
| Seminole | 0.0 /100 | #286 | Tragic 8.7% |
| Menominee | 0.0 /100 | #287 | Tragic 8.7% |
| Bahamians | 0.0 /100 | #288 | Tragic 8.7% |
| Iroquois | 0.0 /100 | #289 | Tragic 8.7% |
| Vietnamese | 0.0 /100 | #290 | Tragic 8.8% |
| Jamaicans | 0.0 /100 | #291 | Tragic 8.8% |
| Cheyenne | 0.0 /100 | #292 | Tragic 8.8% |
| Immigrants | Bangladesh | 0.0 /100 | #293 | Tragic 8.8% |
| Immigrants | Nonimmigrants | 0.0 /100 | #294 | Tragic 8.8% |
| Immigrants | Central America | 0.0 /100 | #295 | Tragic 8.9% |
| Immigrants | Dominican Republic | 0.0 /100 | #296 | Tragic 8.9% |
| Mexicans | 0.0 /100 | #297 | Tragic 8.9% |
| Tlingit-Haida | 0.0 /100 | #298 | Tragic 8.9% |
Demographics Similar to Dutch West Indians by Unemployment Among Women with Children Under 6 years
In terms of unemployment among women with children under 6 years, the demographic groups most similar to Dutch West Indians are Osage (9.5%, a difference of 0.060%), Houma (9.4%, a difference of 0.79%), Marshallese (9.6%, a difference of 1.1%), Potawatomi (9.6%, a difference of 1.1%), and Central American Indian (9.6%, a difference of 1.2%).
| Demographics | Rating | Rank | Unemployment Among Women with Children Under 6 years |
| Cajuns | 0.0 /100 | #310 | Tragic 9.2% |
| French American Indians | 0.0 /100 | #311 | Tragic 9.2% |
| Immigrants | Azores | 0.0 /100 | #312 | Tragic 9.2% |
| Americans | 0.0 /100 | #313 | Tragic 9.3% |
| Fijians | 0.0 /100 | #314 | Tragic 9.3% |
| Cherokee | 0.0 /100 | #315 | Tragic 9.3% |
| Houma | 0.0 /100 | #316 | Tragic 9.4% |
| Dutch West Indians | 0.0 /100 | #317 | Tragic 9.5% |
| Osage | 0.0 /100 | #318 | Tragic 9.5% |
| Marshallese | 0.0 /100 | #319 | Tragic 9.6% |
| Potawatomi | 0.0 /100 | #320 | Tragic 9.6% |
| Central American Indians | 0.0 /100 | #321 | Tragic 9.6% |
| Alaska Natives | 0.0 /100 | #322 | Tragic 9.6% |
| Immigrants | Bahamas | 0.0 /100 | #323 | Tragic 9.6% |
| Paiute | 0.0 /100 | #324 | Tragic 9.7% |