Immigrants from Lithuania vs Immigrants from Western Europe Unemployment Among Women with Children Under 6 years
COMPARE
Immigrants from Lithuania
Immigrants from Western Europe
Unemployment Among Women with Children Under 6 years
Unemployment Among Women with Children Under 6 years Comparison
Immigrants from Lithuania
Immigrants from Western Europe
7.5%
UNEMPLOYMENT AMONG WOMEN WITH CHILDREN UNDER 6 YEARS
68.8/ 100
METRIC RATING
162nd/ 347
METRIC RANK
7.7%
UNEMPLOYMENT AMONG WOMEN WITH CHILDREN UNDER 6 YEARS
44.9/ 100
METRIC RATING
179th/ 347
METRIC RANK
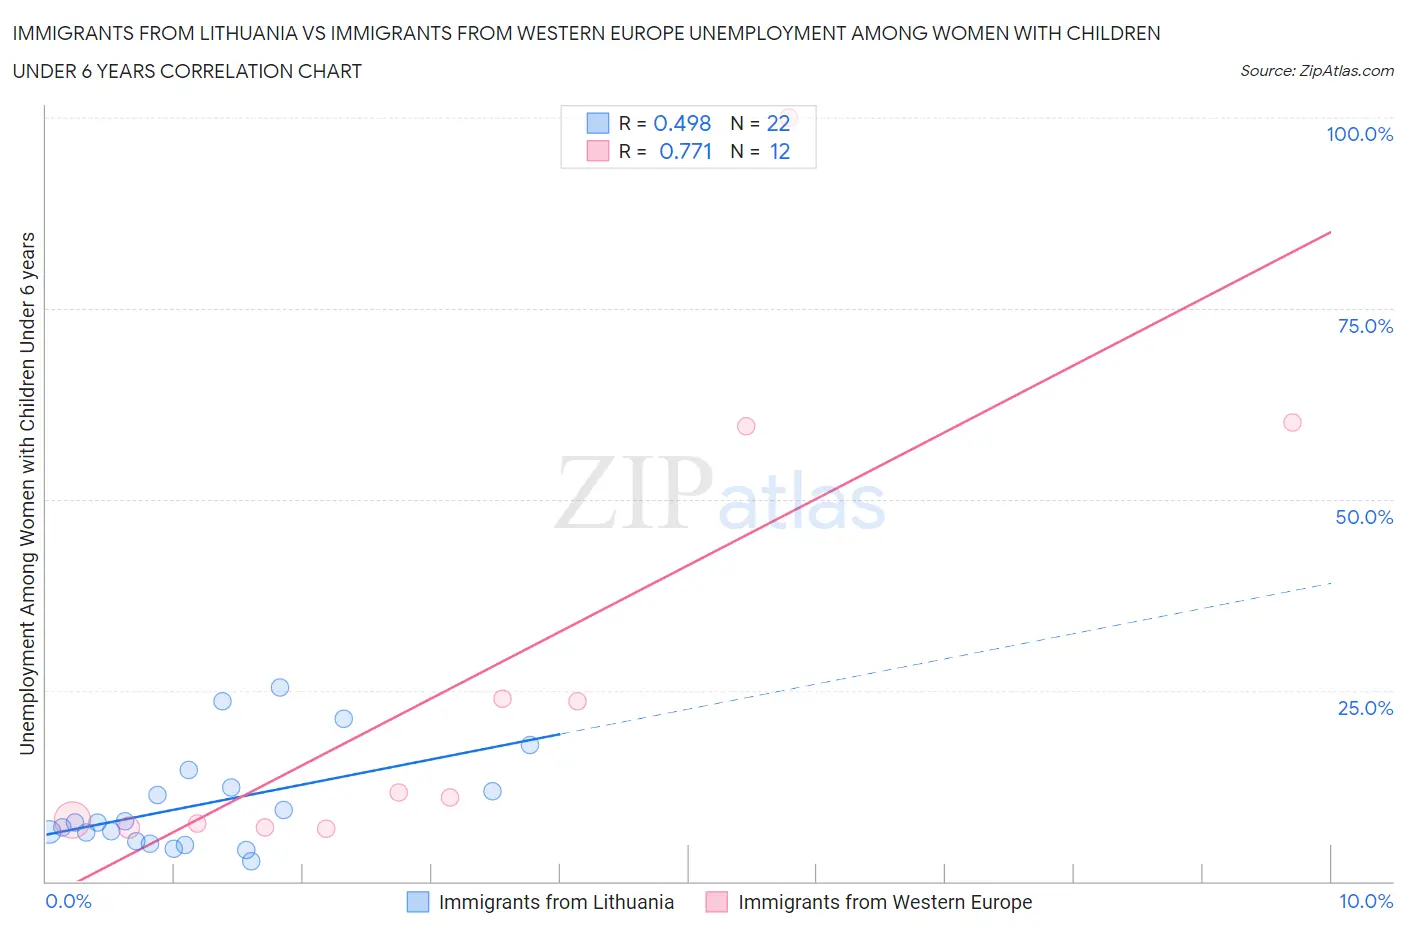
Immigrants from Lithuania vs Immigrants from Western Europe Unemployment Among Women with Children Under 6 years Correlation Chart
The statistical analysis conducted on geographies consisting of 102,015,606 people shows a moderate positive correlation between the proportion of Immigrants from Lithuania and unemployment rate among women with children under the age of 6 in the United States with a correlation coefficient (R) of 0.498 and weighted average of 7.5%. Similarly, the statistical analysis conducted on geographies consisting of 350,429,370 people shows a strong positive correlation between the proportion of Immigrants from Western Europe and unemployment rate among women with children under the age of 6 in the United States with a correlation coefficient (R) of 0.771 and weighted average of 7.7%, a difference of 1.7%.
Unemployment Among Women with Children Under 6 years Correlation Summary
| Measurement | Immigrants from Lithuania | Immigrants from Western Europe |
| Minimum | 2.7% | 6.8% |
| Maximum | 25.3% | 100.0% |
| Range | 22.6% | 93.2% |
| Mean | 10.1% | 27.2% |
| Median | 7.7% | 11.3% |
| Interquartile 25% (IQ1) | 5.2% | 7.3% |
| Interquartile 75% (IQ3) | 12.2% | 41.8% |
| Interquartile Range (IQR) | 7.0% | 34.5% |
| Standard Deviation (Sample) | 6.5% | 30.1% |
| Standard Deviation (Population) | 6.4% | 28.8% |
Demographics Similar to Immigrants from Lithuania and Immigrants from Western Europe by Unemployment Among Women with Children Under 6 years
In terms of unemployment among women with children under 6 years, the demographic groups most similar to Immigrants from Lithuania are Immigrants from Western Asia (7.5%, a difference of 0.12%), Bolivian (7.5%, a difference of 0.16%), British (7.6%, a difference of 0.19%), Ugandan (7.6%, a difference of 0.23%), and Immigrants from South America (7.6%, a difference of 0.24%). Similarly, the demographic groups most similar to Immigrants from Western Europe are Immigrants from England (7.7%, a difference of 0.030%), Immigrants from Uruguay (7.7%, a difference of 0.030%), Austrian (7.7%, a difference of 0.070%), Puget Sound Salish (7.7%, a difference of 0.19%), and Panamanian (7.6%, a difference of 0.32%).
| Demographics | Rating | Rank | Unemployment Among Women with Children Under 6 years |
| Bolivians | 70.8 /100 | #160 | Good 7.5% |
| Immigrants | Western Asia | 70.2 /100 | #161 | Good 7.5% |
| Immigrants | Lithuania | 68.8 /100 | #162 | Good 7.5% |
| British | 66.3 /100 | #163 | Good 7.6% |
| Ugandans | 65.8 /100 | #164 | Good 7.6% |
| Immigrants | South America | 65.6 /100 | #165 | Good 7.6% |
| Belgians | 63.5 /100 | #166 | Good 7.6% |
| Kenyans | 62.5 /100 | #167 | Good 7.6% |
| Immigrants | Canada | 61.6 /100 | #168 | Good 7.6% |
| Immigrants | Scotland | 61.3 /100 | #169 | Good 7.6% |
| Czechs | 59.8 /100 | #170 | Average 7.6% |
| Immigrants | Grenada | 59.0 /100 | #171 | Average 7.6% |
| Immigrants | North America | 57.7 /100 | #172 | Average 7.6% |
| Cree | 51.6 /100 | #173 | Average 7.6% |
| Immigrants | Laos | 50.0 /100 | #174 | Average 7.6% |
| Panamanians | 49.6 /100 | #175 | Average 7.6% |
| Puget Sound Salish | 47.7 /100 | #176 | Average 7.7% |
| Austrians | 46.0 /100 | #177 | Average 7.7% |
| Immigrants | England | 45.4 /100 | #178 | Average 7.7% |
| Immigrants | Western Europe | 44.9 /100 | #179 | Average 7.7% |
| Immigrants | Uruguay | 44.5 /100 | #180 | Average 7.7% |