Immigrants from Lithuania vs Indian (Asian) Unemployment Among Women with Children Ages 6 to 17 years
COMPARE
Immigrants from Lithuania
Indian (Asian)
Unemployment Among Women with Children Ages 6 to 17 years
Unemployment Among Women with Children Ages 6 to 17 years Comparison
Immigrants from Lithuania
Indians (Asian)
8.6%
UNEMPLOYMENT AMONG WOMEN WITH CHILDREN AGES 6 TO 17 YEARS
98.4/ 100
METRIC RATING
99th/ 347
METRIC RANK
7.7%
UNEMPLOYMENT AMONG WOMEN WITH CHILDREN AGES 6 TO 17 YEARS
100.0/ 100
METRIC RATING
26th/ 347
METRIC RANK
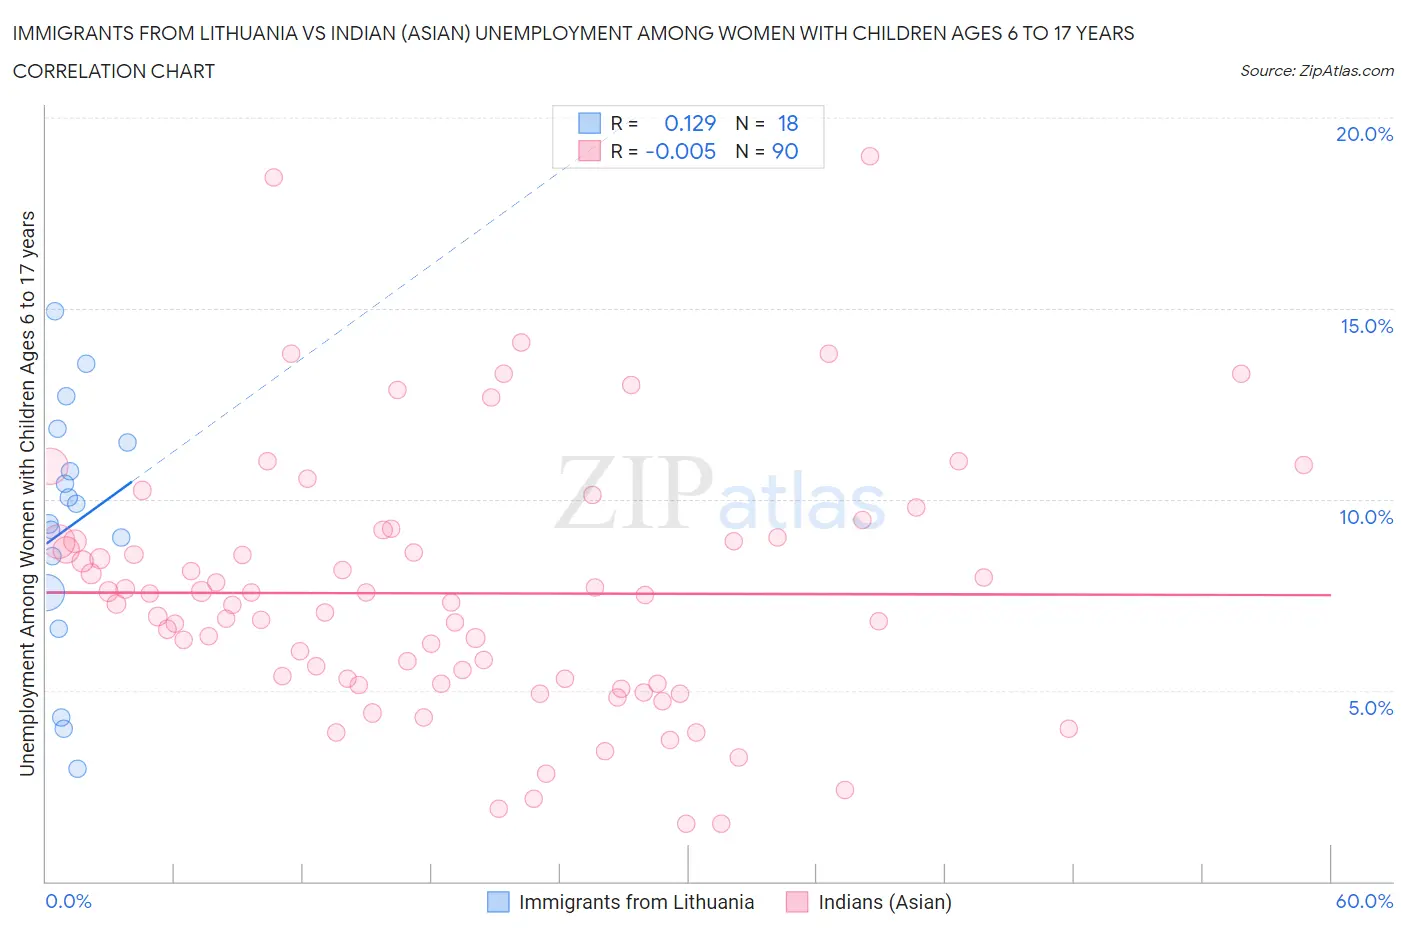
Immigrants from Lithuania vs Indian (Asian) Unemployment Among Women with Children Ages 6 to 17 years Correlation Chart
The statistical analysis conducted on geographies consisting of 97,683,063 people shows a poor positive correlation between the proportion of Immigrants from Lithuania and unemployment rate among women with children between the ages 6 and 17 in the United States with a correlation coefficient (R) of 0.129 and weighted average of 8.6%. Similarly, the statistical analysis conducted on geographies consisting of 335,697,712 people shows no correlation between the proportion of Indians (Asian) and unemployment rate among women with children between the ages 6 and 17 in the United States with a correlation coefficient (R) of -0.005 and weighted average of 7.7%, a difference of 10.8%.
Unemployment Among Women with Children Ages 6 to 17 years Correlation Summary
| Measurement | Immigrants from Lithuania | Indian (Asian) |
| Minimum | 3.0% | 1.5% |
| Maximum | 14.9% | 19.0% |
| Range | 12.0% | 17.5% |
| Mean | 9.3% | 7.5% |
| Median | 9.6% | 7.3% |
| Interquartile 25% (IQ1) | 7.5% | 5.2% |
| Interquartile 75% (IQ3) | 11.5% | 8.9% |
| Interquartile Range (IQR) | 4.0% | 3.7% |
| Standard Deviation (Sample) | 3.3% | 3.4% |
| Standard Deviation (Population) | 3.2% | 3.4% |
Similar Demographics by Unemployment Among Women with Children Ages 6 to 17 years
Demographics Similar to Immigrants from Lithuania by Unemployment Among Women with Children Ages 6 to 17 years
In terms of unemployment among women with children ages 6 to 17 years, the demographic groups most similar to Immigrants from Lithuania are New Zealander (8.6%, a difference of 0.0%), Immigrants from Pakistan (8.6%, a difference of 0.0%), Immigrants from South Africa (8.6%, a difference of 0.030%), Scandinavian (8.6%, a difference of 0.040%), and Malaysian (8.6%, a difference of 0.080%).
| Demographics | Rating | Rank | Unemployment Among Women with Children Ages 6 to 17 years |
| Potawatomi | 99.0 /100 | #92 | Exceptional 8.5% |
| Australians | 98.9 /100 | #93 | Exceptional 8.5% |
| Immigrants | Barbados | 98.8 /100 | #94 | Exceptional 8.5% |
| Sri Lankans | 98.7 /100 | #95 | Exceptional 8.5% |
| German Russians | 98.6 /100 | #96 | Exceptional 8.5% |
| Bolivians | 98.5 /100 | #97 | Exceptional 8.5% |
| Malaysians | 98.5 /100 | #98 | Exceptional 8.6% |
| Immigrants | Lithuania | 98.4 /100 | #99 | Exceptional 8.6% |
| New Zealanders | 98.4 /100 | #100 | Exceptional 8.6% |
| Immigrants | Pakistan | 98.4 /100 | #101 | Exceptional 8.6% |
| Immigrants | South Africa | 98.3 /100 | #102 | Exceptional 8.6% |
| Scandinavians | 98.3 /100 | #103 | Exceptional 8.6% |
| Immigrants | France | 98.0 /100 | #104 | Exceptional 8.6% |
| Immigrants | Norway | 97.8 /100 | #105 | Exceptional 8.6% |
| Immigrants | Serbia | 97.7 /100 | #106 | Exceptional 8.6% |
Demographics Similar to Indians (Asian) by Unemployment Among Women with Children Ages 6 to 17 years
In terms of unemployment among women with children ages 6 to 17 years, the demographic groups most similar to Indians (Asian) are Immigrants from Eastern Asia (7.7%, a difference of 0.010%), Immigrants from Indonesia (7.7%, a difference of 0.13%), Nepalese (7.7%, a difference of 0.13%), Immigrants from China (7.7%, a difference of 0.52%), and Immigrants from Afghanistan (7.8%, a difference of 0.63%).
| Demographics | Rating | Rank | Unemployment Among Women with Children Ages 6 to 17 years |
| Filipinos | 100.0 /100 | #19 | Exceptional 7.6% |
| Immigrants | Singapore | 100.0 /100 | #20 | Exceptional 7.7% |
| Immigrants | India | 100.0 /100 | #21 | Exceptional 7.7% |
| Immigrants | China | 100.0 /100 | #22 | Exceptional 7.7% |
| Immigrants | Indonesia | 100.0 /100 | #23 | Exceptional 7.7% |
| Nepalese | 100.0 /100 | #24 | Exceptional 7.7% |
| Immigrants | Eastern Asia | 100.0 /100 | #25 | Exceptional 7.7% |
| Indians (Asian) | 100.0 /100 | #26 | Exceptional 7.7% |
| Immigrants | Afghanistan | 100.0 /100 | #27 | Exceptional 7.8% |
| Immigrants | Uzbekistan | 100.0 /100 | #28 | Exceptional 7.8% |
| Thais | 100.0 /100 | #29 | Exceptional 7.8% |
| Immigrants | Iran | 100.0 /100 | #30 | Exceptional 7.9% |
| Laotians | 100.0 /100 | #31 | Exceptional 7.9% |
| Immigrants | Cambodia | 100.0 /100 | #32 | Exceptional 7.9% |
| Immigrants | Korea | 100.0 /100 | #33 | Exceptional 7.9% |