Soviet Union vs Immigrants from Yemen Male Unemployment
COMPARE
Soviet Union
Immigrants from Yemen
Male Unemployment
Male Unemployment Comparison
Soviet Union
Immigrants from Yemen
5.6%
MALE UNEMPLOYMENT
3.2/ 100
METRIC RATING
221st/ 347
METRIC RANK
7.8%
MALE UNEMPLOYMENT
0.0/ 100
METRIC RATING
329th/ 347
METRIC RANK
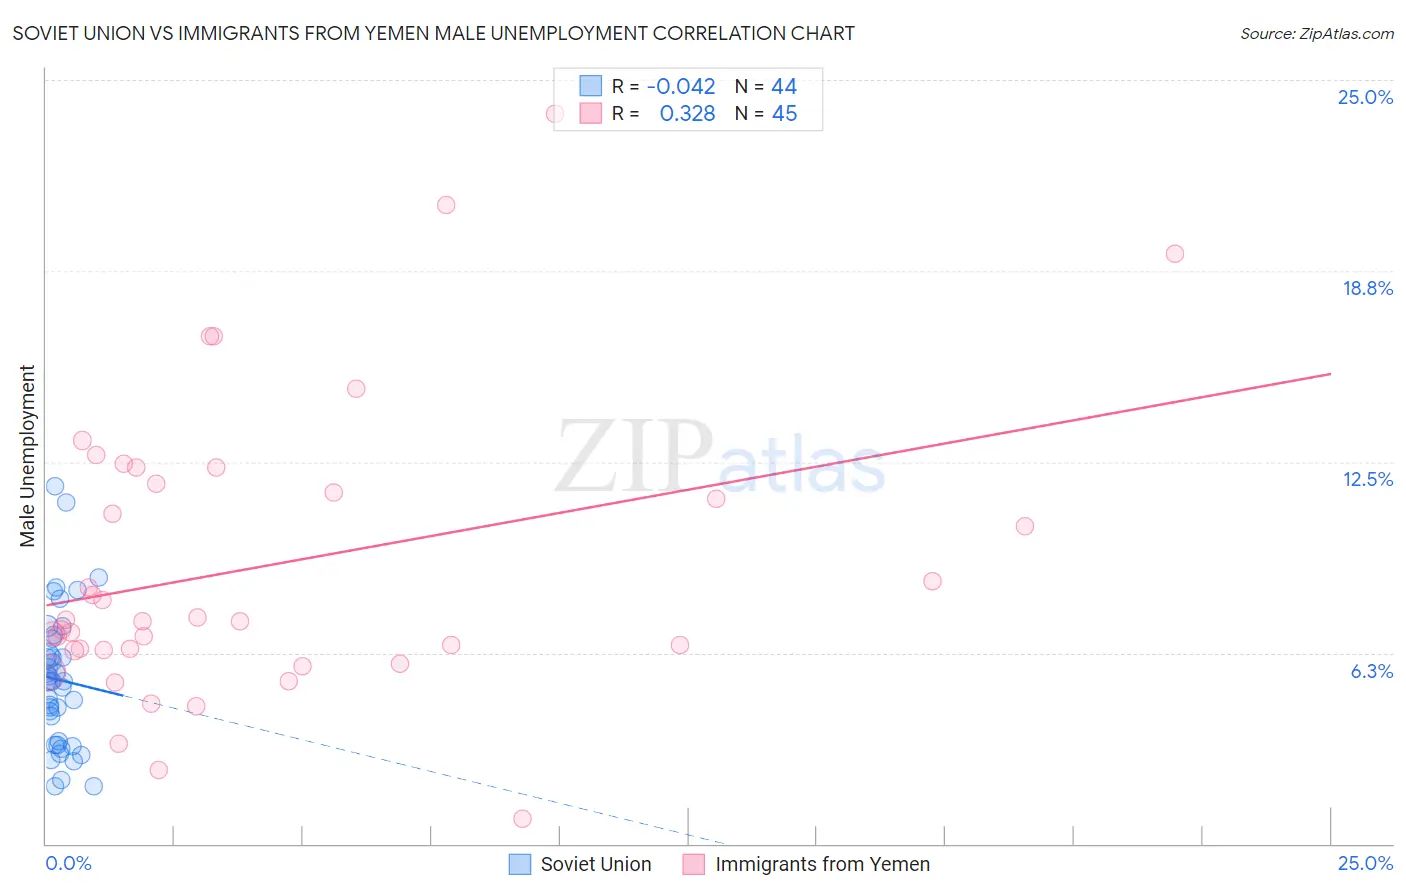
Soviet Union vs Immigrants from Yemen Male Unemployment Correlation Chart
The statistical analysis conducted on geographies consisting of 43,494,943 people shows no correlation between the proportion of Soviet Union and unemployment rate among males in the United States with a correlation coefficient (R) of -0.042 and weighted average of 5.6%. Similarly, the statistical analysis conducted on geographies consisting of 82,399,512 people shows a mild positive correlation between the proportion of Immigrants from Yemen and unemployment rate among males in the United States with a correlation coefficient (R) of 0.328 and weighted average of 7.8%, a difference of 40.1%.
Male Unemployment Correlation Summary
| Measurement | Soviet Union | Immigrants from Yemen |
| Minimum | 1.9% | 0.80% |
| Maximum | 11.7% | 23.9% |
| Range | 9.8% | 23.1% |
| Mean | 5.4% | 9.1% |
| Median | 5.3% | 7.3% |
| Interquartile 25% (IQ1) | 3.3% | 6.3% |
| Interquartile 75% (IQ3) | 6.4% | 12.1% |
| Interquartile Range (IQR) | 3.1% | 5.7% |
| Standard Deviation (Sample) | 2.3% | 4.8% |
| Standard Deviation (Population) | 2.2% | 4.8% |
Similar Demographics by Male Unemployment
Demographics Similar to Soviet Union by Male Unemployment
In terms of male unemployment, the demographic groups most similar to Soviet Union are Portuguese (5.6%, a difference of 0.11%), Immigrants from Western Asia (5.6%, a difference of 0.13%), Immigrants from Micronesia (5.6%, a difference of 0.14%), Immigrants from Albania (5.5%, a difference of 0.18%), and Creek (5.6%, a difference of 0.29%).
| Demographics | Rating | Rank | Male Unemployment |
| Puget Sound Salish | 5.6 /100 | #214 | Tragic 5.5% |
| Samoans | 4.9 /100 | #215 | Tragic 5.5% |
| Immigrants | Immigrants | 4.3 /100 | #216 | Tragic 5.5% |
| Delaware | 4.2 /100 | #217 | Tragic 5.5% |
| Immigrants | Albania | 3.6 /100 | #218 | Tragic 5.5% |
| Immigrants | Western Asia | 3.5 /100 | #219 | Tragic 5.6% |
| Portuguese | 3.5 /100 | #220 | Tragic 5.6% |
| Soviet Union | 3.2 /100 | #221 | Tragic 5.6% |
| Immigrants | Micronesia | 2.9 /100 | #222 | Tragic 5.6% |
| Creek | 2.6 /100 | #223 | Tragic 5.6% |
| Cherokee | 2.4 /100 | #224 | Tragic 5.6% |
| Panamanians | 1.9 /100 | #225 | Tragic 5.6% |
| Immigrants | Cambodia | 1.8 /100 | #226 | Tragic 5.6% |
| Immigrants | Panama | 1.8 /100 | #227 | Tragic 5.6% |
| Seminole | 1.8 /100 | #228 | Tragic 5.6% |
Demographics Similar to Immigrants from Yemen by Male Unemployment
In terms of male unemployment, the demographic groups most similar to Immigrants from Yemen are Native/Alaskan (7.7%, a difference of 0.90%), Paiute (7.7%, a difference of 1.3%), Yakama (7.9%, a difference of 1.8%), Immigrants from Dominican Republic (7.6%, a difference of 2.4%), and Shoshone (7.6%, a difference of 2.5%).
| Demographics | Rating | Rank | Male Unemployment |
| Immigrants | Cabo Verde | 0.0 /100 | #322 | Tragic 7.5% |
| Immigrants | Grenada | 0.0 /100 | #323 | Tragic 7.6% |
| Dominicans | 0.0 /100 | #324 | Tragic 7.6% |
| Shoshone | 0.0 /100 | #325 | Tragic 7.6% |
| Immigrants | Dominican Republic | 0.0 /100 | #326 | Tragic 7.6% |
| Paiute | 0.0 /100 | #327 | Tragic 7.7% |
| Natives/Alaskans | 0.0 /100 | #328 | Tragic 7.7% |
| Immigrants | Yemen | 0.0 /100 | #329 | Tragic 7.8% |
| Yakama | 0.0 /100 | #330 | Tragic 7.9% |
| Alaska Natives | 0.0 /100 | #331 | Tragic 8.1% |
| Pima | 0.0 /100 | #332 | Tragic 8.3% |
| Sioux | 0.0 /100 | #333 | Tragic 8.4% |
| Tsimshian | 0.0 /100 | #334 | Tragic 8.5% |
| Pueblo | 0.0 /100 | #335 | Tragic 8.5% |
| Yuman | 0.0 /100 | #336 | Tragic 8.6% |