Immigrants from Egypt vs Immigrants from Sweden Unemployment Among Youth under 25 years
COMPARE
Immigrants from Egypt
Immigrants from Sweden
Unemployment Among Youth under 25 years
Unemployment Among Youth under 25 years Comparison
Immigrants from Egypt
Immigrants from Sweden
11.7%
UNEMPLOYMENT AMONG YOUTH UNDER 25 YEARS
31.9/ 100
METRIC RATING
187th/ 347
METRIC RANK
11.5%
UNEMPLOYMENT AMONG YOUTH UNDER 25 YEARS
61.3/ 100
METRIC RATING
165th/ 347
METRIC RANK
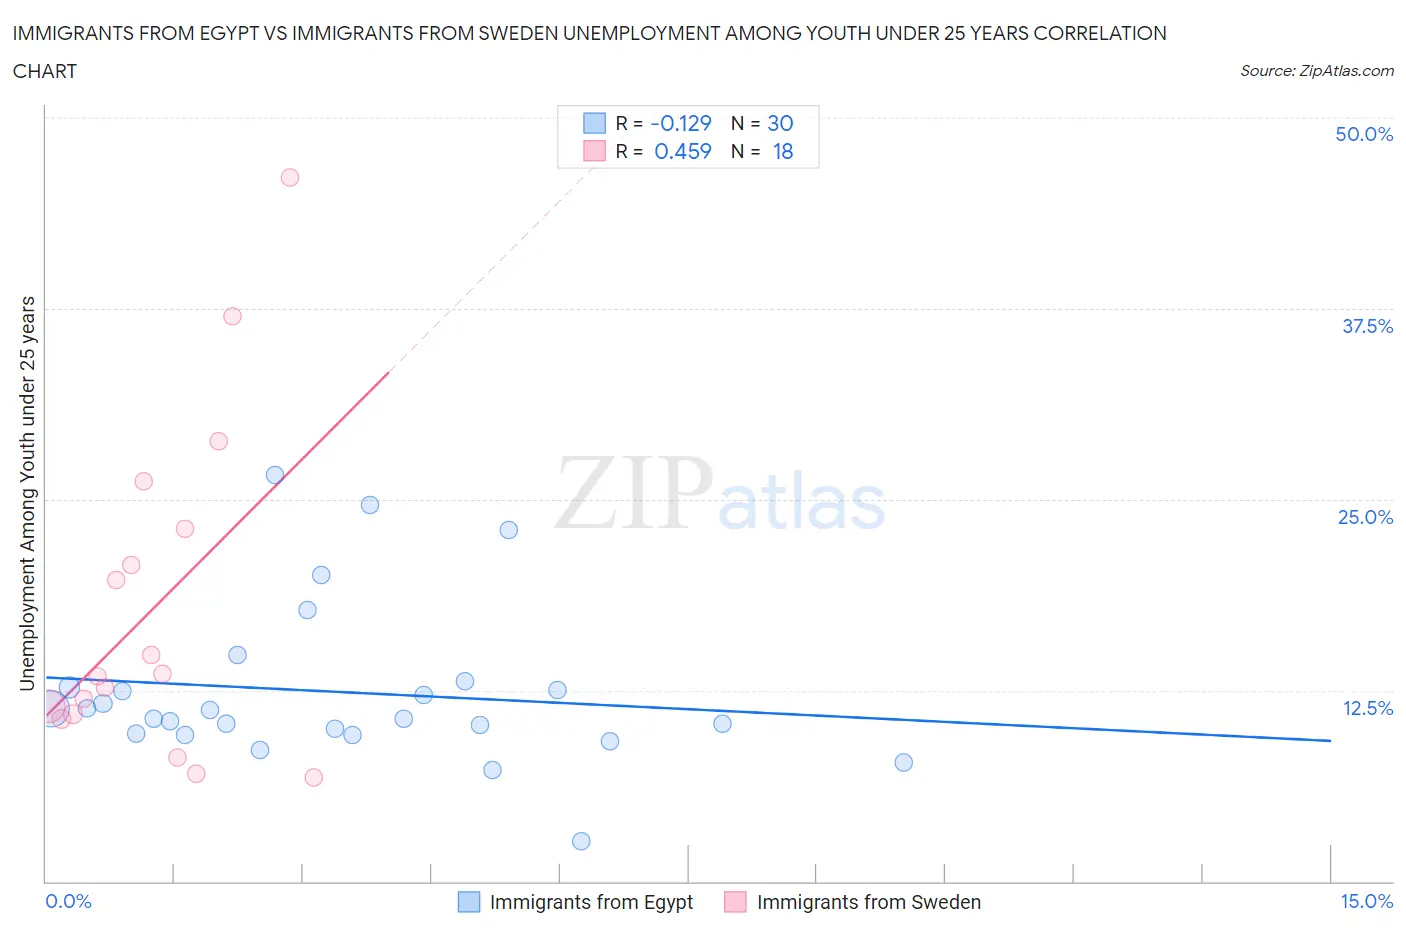
Immigrants from Egypt vs Immigrants from Sweden Unemployment Among Youth under 25 years Correlation Chart
The statistical analysis conducted on geographies consisting of 244,339,413 people shows a poor negative correlation between the proportion of Immigrants from Egypt and unemployment rate among youth under the age of 25 in the United States with a correlation coefficient (R) of -0.129 and weighted average of 11.7%. Similarly, the statistical analysis conducted on geographies consisting of 163,767,468 people shows a moderate positive correlation between the proportion of Immigrants from Sweden and unemployment rate among youth under the age of 25 in the United States with a correlation coefficient (R) of 0.459 and weighted average of 11.5%, a difference of 1.3%.
Unemployment Among Youth under 25 years Correlation Summary
| Measurement | Immigrants from Egypt | Immigrants from Sweden |
| Minimum | 2.6% | 6.8% |
| Maximum | 26.6% | 46.1% |
| Range | 24.0% | 39.3% |
| Mean | 12.4% | 18.0% |
| Median | 10.9% | 13.5% |
| Interquartile 25% (IQ1) | 9.6% | 10.9% |
| Interquartile 75% (IQ3) | 12.6% | 23.1% |
| Interquartile Range (IQR) | 3.0% | 12.2% |
| Standard Deviation (Sample) | 5.2% | 10.8% |
| Standard Deviation (Population) | 5.1% | 10.5% |
Similar Demographics by Unemployment Among Youth under 25 years
Demographics Similar to Immigrants from Egypt by Unemployment Among Youth under 25 years
In terms of unemployment among youth under 25 years, the demographic groups most similar to Immigrants from Egypt are Immigrants from Poland (11.7%, a difference of 0.030%), Japanese (11.7%, a difference of 0.050%), Portuguese (11.7%, a difference of 0.080%), French American Indian (11.7%, a difference of 0.090%), and Maltese (11.7%, a difference of 0.090%).
| Demographics | Rating | Rank | Unemployment Among Youth under 25 years |
| Spaniards | 39.8 /100 | #180 | Fair 11.7% |
| Syrians | 38.4 /100 | #181 | Fair 11.7% |
| Immigrants | Italy | 36.2 /100 | #182 | Fair 11.7% |
| Americans | 34.5 /100 | #183 | Fair 11.7% |
| Immigrants | Eastern Europe | 34.1 /100 | #184 | Fair 11.7% |
| French American Indians | 34.0 /100 | #185 | Fair 11.7% |
| Maltese | 33.9 /100 | #186 | Fair 11.7% |
| Immigrants | Egypt | 31.9 /100 | #187 | Fair 11.7% |
| Immigrants | Poland | 31.4 /100 | #188 | Fair 11.7% |
| Japanese | 30.8 /100 | #189 | Fair 11.7% |
| Portuguese | 30.3 /100 | #190 | Fair 11.7% |
| Cypriots | 28.5 /100 | #191 | Fair 11.7% |
| Immigrants | Russia | 28.5 /100 | #192 | Fair 11.7% |
| Seminole | 27.9 /100 | #193 | Fair 11.7% |
| Immigrants | Sri Lanka | 27.8 /100 | #194 | Fair 11.7% |
Demographics Similar to Immigrants from Sweden by Unemployment Among Youth under 25 years
In terms of unemployment among youth under 25 years, the demographic groups most similar to Immigrants from Sweden are Spanish (11.6%, a difference of 0.040%), Immigrants from Laos (11.5%, a difference of 0.050%), Immigrants from Northern Africa (11.5%, a difference of 0.060%), Immigrants from Kazakhstan (11.5%, a difference of 0.060%), and Okinawan (11.6%, a difference of 0.11%).
| Demographics | Rating | Rank | Unemployment Among Youth under 25 years |
| Immigrants | Turkey | 64.8 /100 | #158 | Good 11.5% |
| Immigrants | Western Europe | 64.7 /100 | #159 | Good 11.5% |
| Immigrants | Eastern Asia | 64.5 /100 | #160 | Good 11.5% |
| Ukrainians | 64.3 /100 | #161 | Good 11.5% |
| Immigrants | Northern Africa | 62.7 /100 | #162 | Good 11.5% |
| Immigrants | Kazakhstan | 62.7 /100 | #163 | Good 11.5% |
| Immigrants | Laos | 62.4 /100 | #164 | Good 11.5% |
| Immigrants | Sweden | 61.3 /100 | #165 | Good 11.5% |
| Spanish | 60.3 /100 | #166 | Good 11.6% |
| Okinawans | 58.7 /100 | #167 | Average 11.6% |
| Potawatomi | 57.9 /100 | #168 | Average 11.6% |
| Eastern Europeans | 57.5 /100 | #169 | Average 11.6% |
| Russians | 57.3 /100 | #170 | Average 11.6% |
| Bangladeshis | 55.6 /100 | #171 | Average 11.6% |
| Immigrants | Morocco | 55.1 /100 | #172 | Average 11.6% |