Immigrants from Lebanon vs Creek Unemployment Among Ages 20 to 24 years
COMPARE
Immigrants from Lebanon
Creek
Unemployment Among Ages 20 to 24 years
Unemployment Among Ages 20 to 24 years Comparison
Immigrants from Lebanon
Creek
10.9%
UNEMPLOYMENT AMONG AGES 20 TO 24 YEARS
0.2/ 100
METRIC RATING
260th/ 347
METRIC RANK
9.7%
UNEMPLOYMENT AMONG AGES 20 TO 24 YEARS
99.8/ 100
METRIC RATING
49th/ 347
METRIC RANK
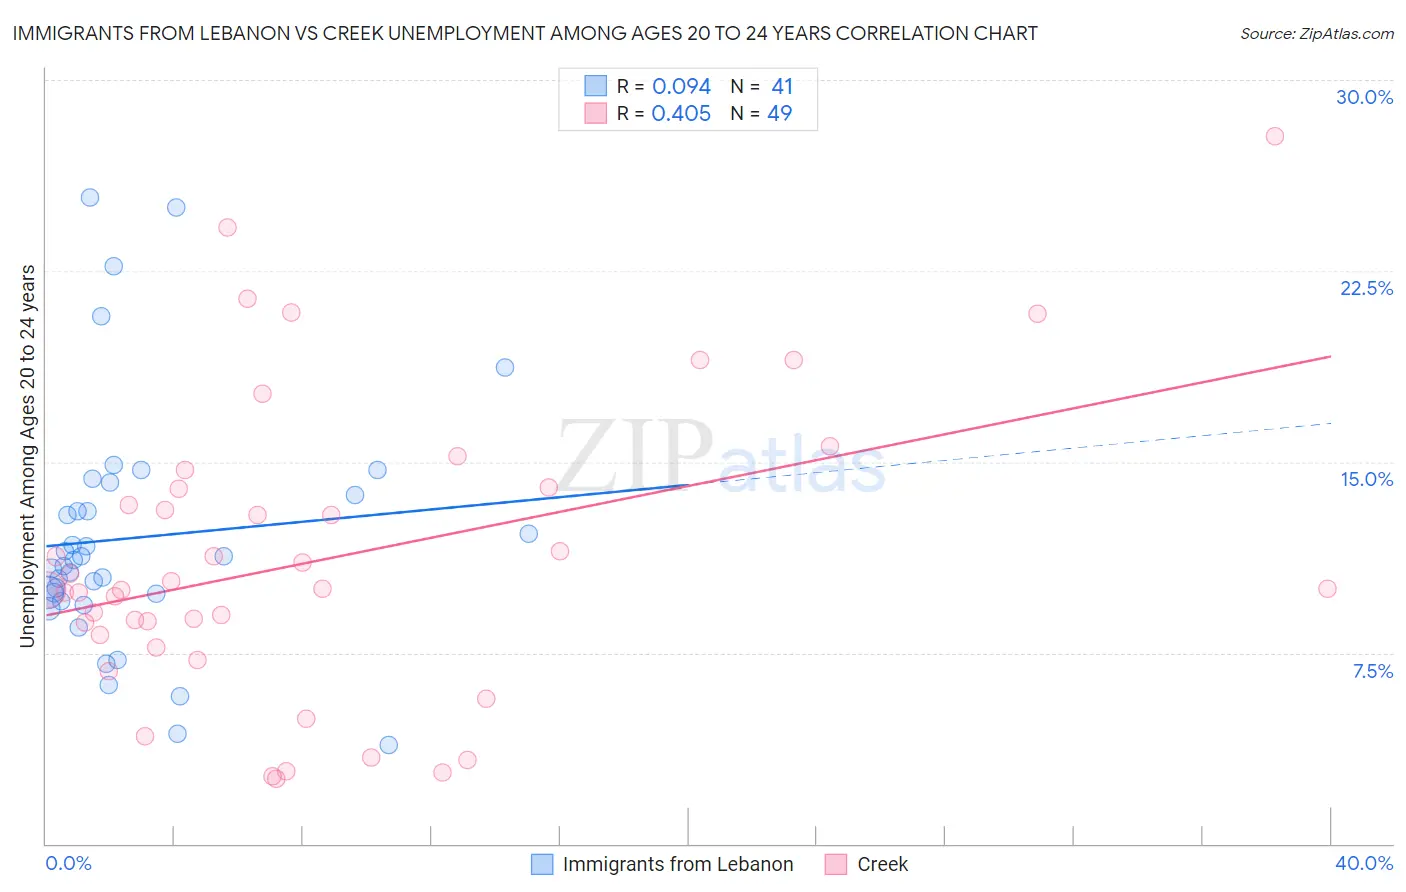
Immigrants from Lebanon vs Creek Unemployment Among Ages 20 to 24 years Correlation Chart
The statistical analysis conducted on geographies consisting of 214,292,748 people shows a slight positive correlation between the proportion of Immigrants from Lebanon and unemployment rate among population between the ages 20 and 24 in the United States with a correlation coefficient (R) of 0.094 and weighted average of 10.9%. Similarly, the statistical analysis conducted on geographies consisting of 174,635,807 people shows a moderate positive correlation between the proportion of Creek and unemployment rate among population between the ages 20 and 24 in the United States with a correlation coefficient (R) of 0.405 and weighted average of 9.7%, a difference of 11.8%.
Unemployment Among Ages 20 to 24 years Correlation Summary
| Measurement | Immigrants from Lebanon | Creek |
| Minimum | 3.9% | 2.5% |
| Maximum | 25.4% | 27.8% |
| Range | 21.5% | 25.3% |
| Mean | 12.0% | 11.2% |
| Median | 11.1% | 10.0% |
| Interquartile 25% (IQ1) | 9.7% | 8.0% |
| Interquartile 75% (IQ3) | 13.9% | 14.0% |
| Interquartile Range (IQR) | 4.3% | 6.0% |
| Standard Deviation (Sample) | 4.8% | 5.8% |
| Standard Deviation (Population) | 4.8% | 5.7% |
Similar Demographics by Unemployment Among Ages 20 to 24 years
Demographics Similar to Immigrants from Lebanon by Unemployment Among Ages 20 to 24 years
In terms of unemployment among ages 20 to 24 years, the demographic groups most similar to Immigrants from Lebanon are Panamanian (10.9%, a difference of 0.030%), Dutch West Indian (10.9%, a difference of 0.13%), Immigrants from Western Asia (10.9%, a difference of 0.20%), Puget Sound Salish (10.9%, a difference of 0.24%), and Immigrants from Bahamas (10.9%, a difference of 0.27%).
| Demographics | Rating | Rank | Unemployment Among Ages 20 to 24 years |
| Spanish Americans | 0.4 /100 | #253 | Tragic 10.8% |
| Liberians | 0.3 /100 | #254 | Tragic 10.8% |
| Immigrants | Israel | 0.3 /100 | #255 | Tragic 10.8% |
| Immigrants | Bahamas | 0.3 /100 | #256 | Tragic 10.9% |
| Immigrants | Western Asia | 0.3 /100 | #257 | Tragic 10.9% |
| Dutch West Indians | 0.3 /100 | #258 | Tragic 10.9% |
| Panamanians | 0.2 /100 | #259 | Tragic 10.9% |
| Immigrants | Lebanon | 0.2 /100 | #260 | Tragic 10.9% |
| Puget Sound Salish | 0.2 /100 | #261 | Tragic 10.9% |
| Immigrants | Latin America | 0.1 /100 | #262 | Tragic 11.0% |
| Marshallese | 0.1 /100 | #263 | Tragic 11.0% |
| Sub-Saharan Africans | 0.0 /100 | #264 | Tragic 11.1% |
| Immigrants | Ireland | 0.0 /100 | #265 | Tragic 11.1% |
| Immigrants | Liberia | 0.0 /100 | #266 | Tragic 11.1% |
| Immigrants | Greece | 0.0 /100 | #267 | Tragic 11.1% |
Demographics Similar to Creek by Unemployment Among Ages 20 to 24 years
In terms of unemployment among ages 20 to 24 years, the demographic groups most similar to Creek are Finnish (9.7%, a difference of 0.080%), Immigrants from India (9.7%, a difference of 0.090%), Immigrants from Kenya (9.7%, a difference of 0.14%), Immigrants from Nicaragua (9.7%, a difference of 0.21%), and Ethiopian (9.8%, a difference of 0.21%).
| Demographics | Rating | Rank | Unemployment Among Ages 20 to 24 years |
| Immigrants | Saudi Arabia | 99.9 /100 | #42 | Exceptional 9.7% |
| Menominee | 99.8 /100 | #43 | Exceptional 9.7% |
| Europeans | 99.8 /100 | #44 | Exceptional 9.7% |
| Croatians | 99.8 /100 | #45 | Exceptional 9.7% |
| Immigrants | Nicaragua | 99.8 /100 | #46 | Exceptional 9.7% |
| Immigrants | India | 99.8 /100 | #47 | Exceptional 9.7% |
| Finns | 99.8 /100 | #48 | Exceptional 9.7% |
| Creek | 99.8 /100 | #49 | Exceptional 9.7% |
| Immigrants | Kenya | 99.7 /100 | #50 | Exceptional 9.7% |
| Ethiopians | 99.7 /100 | #51 | Exceptional 9.8% |
| Immigrants | Thailand | 99.7 /100 | #52 | Exceptional 9.8% |
| Immigrants | Serbia | 99.6 /100 | #53 | Exceptional 9.8% |
| Immigrants | Cambodia | 99.6 /100 | #54 | Exceptional 9.8% |
| Carpatho Rusyns | 99.6 /100 | #55 | Exceptional 9.8% |
| Nicaraguans | 99.6 /100 | #56 | Exceptional 9.8% |