Immigrants from Latvia vs Liberian Unemployment Among Ages 16 to 19 years
COMPARE
Immigrants from Latvia
Liberian
Unemployment Among Ages 16 to 19 years
Unemployment Among Ages 16 to 19 years Comparison
Immigrants from Latvia
Liberians
16.8%
UNEMPLOYMENT AMONG AGES 16 TO 19 YEARS
97.5/ 100
METRIC RATING
81st/ 347
METRIC RANK
17.9%
UNEMPLOYMENT AMONG AGES 16 TO 19 YEARS
18.6/ 100
METRIC RATING
207th/ 347
METRIC RANK
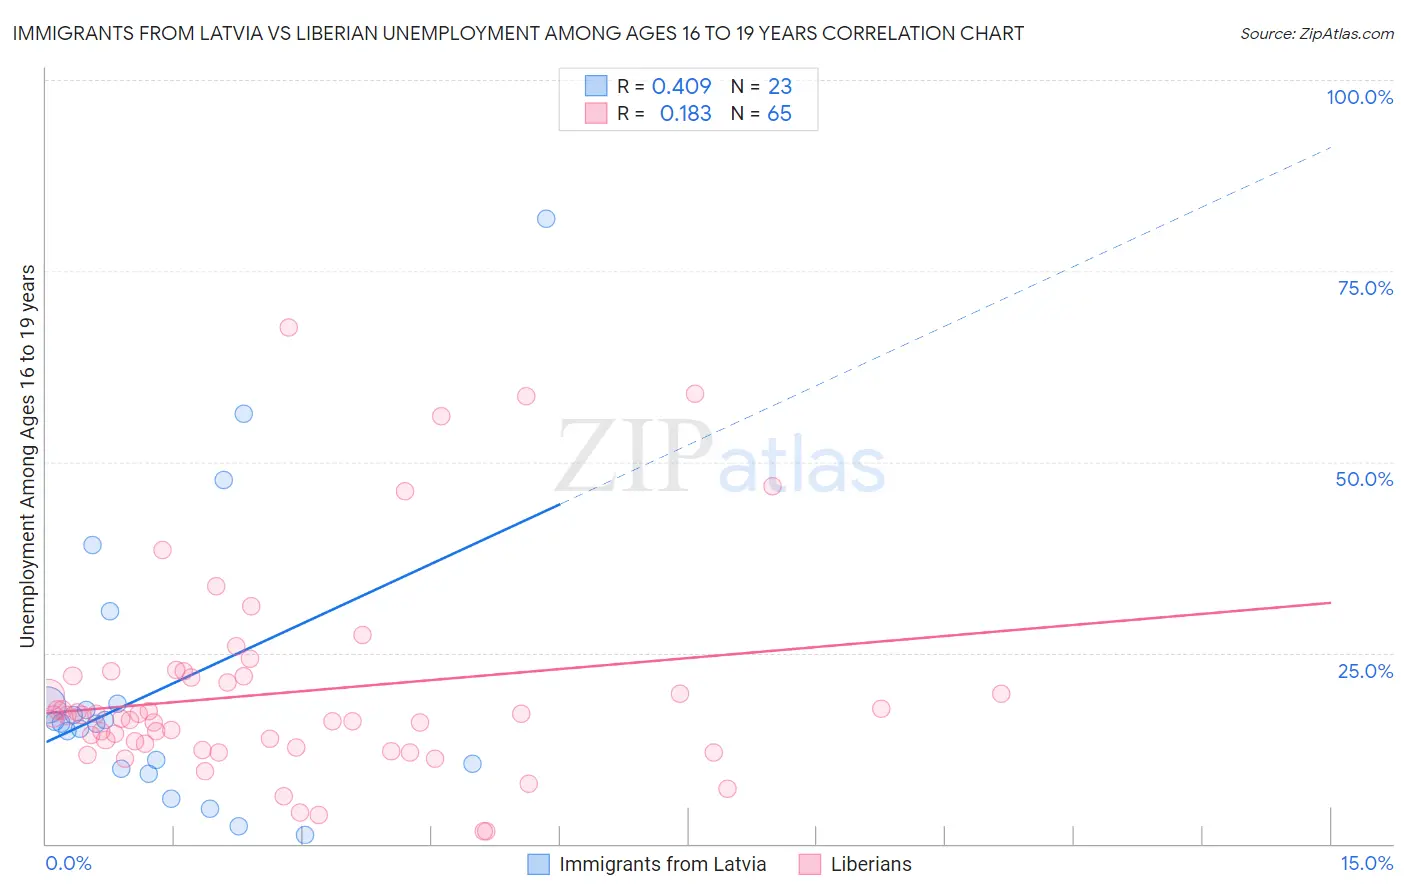
Immigrants from Latvia vs Liberian Unemployment Among Ages 16 to 19 years Correlation Chart
The statistical analysis conducted on geographies consisting of 111,162,820 people shows a moderate positive correlation between the proportion of Immigrants from Latvia and unemployment rate among population between the ages 16 and 19 in the United States with a correlation coefficient (R) of 0.409 and weighted average of 16.8%. Similarly, the statistical analysis conducted on geographies consisting of 116,388,643 people shows a poor positive correlation between the proportion of Liberians and unemployment rate among population between the ages 16 and 19 in the United States with a correlation coefficient (R) of 0.183 and weighted average of 17.9%, a difference of 6.3%.
Unemployment Among Ages 16 to 19 years Correlation Summary
| Measurement | Immigrants from Latvia | Liberian |
| Minimum | 1.1% | 1.6% |
| Maximum | 81.8% | 67.6% |
| Range | 80.7% | 66.0% |
| Mean | 20.6% | 19.8% |
| Median | 15.8% | 16.7% |
| Interquartile 25% (IQ1) | 9.8% | 12.4% |
| Interquartile 75% (IQ3) | 18.4% | 22.0% |
| Interquartile Range (IQR) | 8.6% | 9.6% |
| Standard Deviation (Sample) | 19.1% | 13.5% |
| Standard Deviation (Population) | 18.7% | 13.4% |
Similar Demographics by Unemployment Among Ages 16 to 19 years
Demographics Similar to Immigrants from Latvia by Unemployment Among Ages 16 to 19 years
In terms of unemployment among ages 16 to 19 years, the demographic groups most similar to Immigrants from Latvia are Slovak (16.8%, a difference of 0.0%), French Canadian (16.8%, a difference of 0.0%), White/Caucasian (16.8%, a difference of 0.010%), Ugandan (16.8%, a difference of 0.020%), and French (16.8%, a difference of 0.060%).
| Demographics | Rating | Rank | Unemployment Among Ages 16 to 19 years |
| Immigrants | Eastern Africa | 98.1 /100 | #74 | Exceptional 16.8% |
| New Zealanders | 98.0 /100 | #75 | Exceptional 16.8% |
| Immigrants | North America | 97.9 /100 | #76 | Exceptional 16.8% |
| Immigrants | Singapore | 97.8 /100 | #77 | Exceptional 16.8% |
| Soviet Union | 97.8 /100 | #78 | Exceptional 16.8% |
| Slovaks | 97.5 /100 | #79 | Exceptional 16.8% |
| French Canadians | 97.5 /100 | #80 | Exceptional 16.8% |
| Immigrants | Latvia | 97.5 /100 | #81 | Exceptional 16.8% |
| Whites/Caucasians | 97.5 /100 | #82 | Exceptional 16.8% |
| Ugandans | 97.4 /100 | #83 | Exceptional 16.8% |
| French | 97.4 /100 | #84 | Exceptional 16.8% |
| Immigrants | Kuwait | 97.2 /100 | #85 | Exceptional 16.8% |
| Immigrants | Scotland | 97.2 /100 | #86 | Exceptional 16.8% |
| Greeks | 97.0 /100 | #87 | Exceptional 16.9% |
| Immigrants | South Africa | 96.9 /100 | #88 | Exceptional 16.9% |
Demographics Similar to Liberians by Unemployment Among Ages 16 to 19 years
In terms of unemployment among ages 16 to 19 years, the demographic groups most similar to Liberians are Immigrants from Southern Europe (17.9%, a difference of 0.020%), Hawaiian (17.9%, a difference of 0.15%), Nonimmigrants (17.9%, a difference of 0.16%), Assyrian/Chaldean/Syriac (17.9%, a difference of 0.16%), and Cherokee (17.9%, a difference of 0.24%).
| Demographics | Rating | Rank | Unemployment Among Ages 16 to 19 years |
| Immigrants | Fiji | 27.7 /100 | #200 | Fair 17.8% |
| Immigrants | Ethiopia | 27.4 /100 | #201 | Fair 17.8% |
| Immigrants | Portugal | 27.2 /100 | #202 | Fair 17.8% |
| Immigrants | Eastern Europe | 23.6 /100 | #203 | Fair 17.8% |
| Immigrants | Nonimmigrants | 20.9 /100 | #204 | Fair 17.9% |
| Assyrians/Chaldeans/Syriacs | 20.8 /100 | #205 | Fair 17.9% |
| Immigrants | Southern Europe | 18.9 /100 | #206 | Poor 17.9% |
| Liberians | 18.6 /100 | #207 | Poor 17.9% |
| Hawaiians | 16.8 /100 | #208 | Poor 17.9% |
| Cherokee | 15.7 /100 | #209 | Poor 17.9% |
| Carpatho Rusyns | 15.6 /100 | #210 | Poor 17.9% |
| Guamanians/Chamorros | 14.5 /100 | #211 | Poor 17.9% |
| Argentineans | 13.8 /100 | #212 | Poor 18.0% |
| Chippewa | 13.7 /100 | #213 | Poor 18.0% |
| Immigrants | Morocco | 13.5 /100 | #214 | Poor 18.0% |