Immigrants from Latvia vs Immigrants from Lithuania Unemployment Among Ages 16 to 19 years
COMPARE
Immigrants from Latvia
Immigrants from Lithuania
Unemployment Among Ages 16 to 19 years
Unemployment Among Ages 16 to 19 years Comparison
Immigrants from Latvia
Immigrants from Lithuania
16.8%
UNEMPLOYMENT AMONG AGES 16 TO 19 YEARS
97.5/ 100
METRIC RATING
81st/ 347
METRIC RANK
17.0%
UNEMPLOYMENT AMONG AGES 16 TO 19 YEARS
94.9/ 100
METRIC RATING
99th/ 347
METRIC RANK
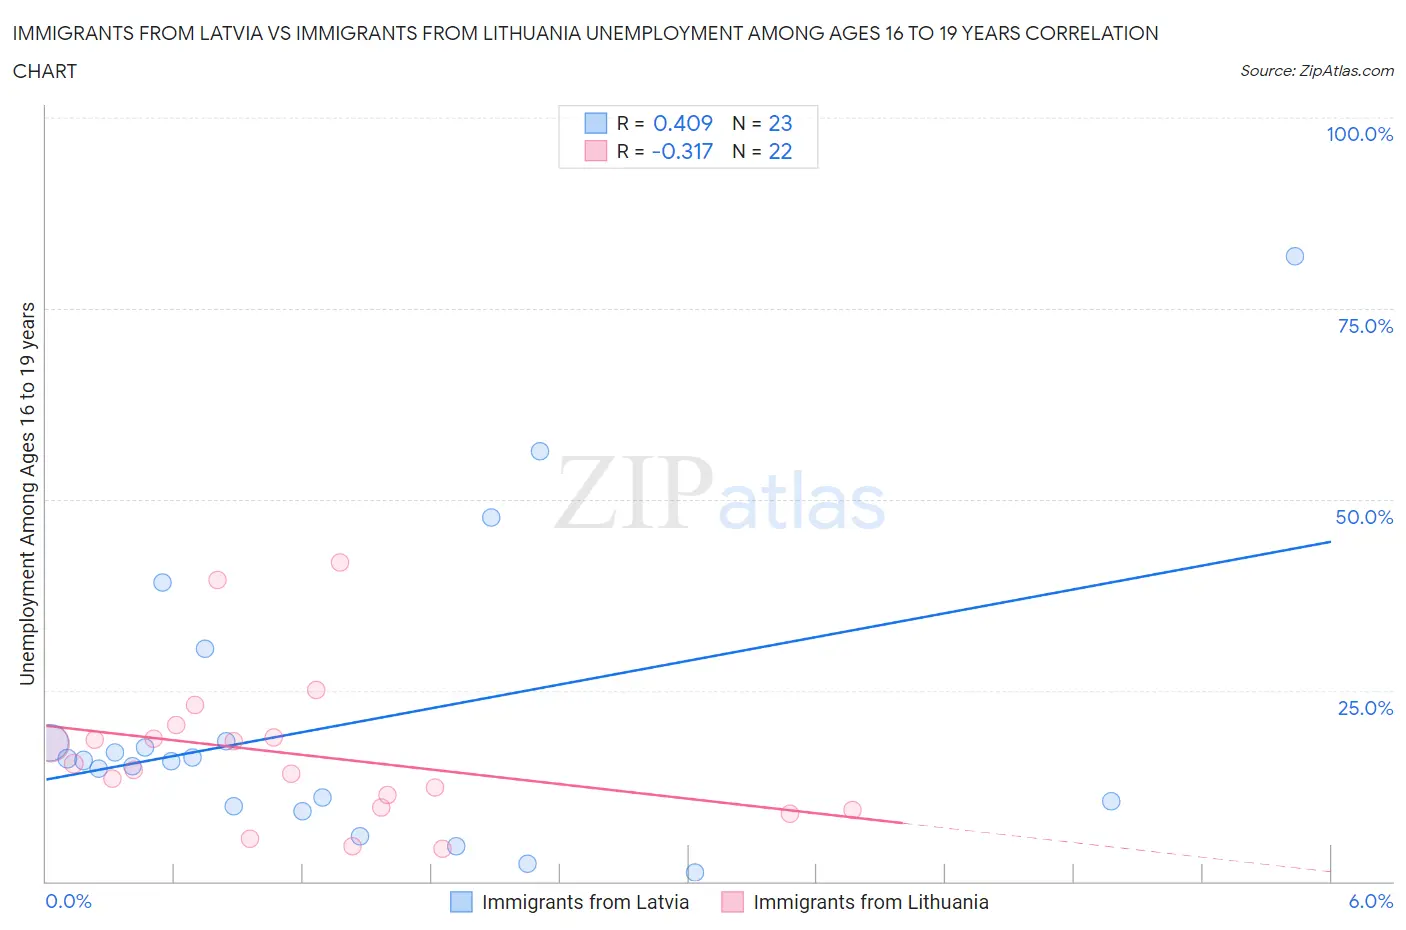
Immigrants from Latvia vs Immigrants from Lithuania Unemployment Among Ages 16 to 19 years Correlation Chart
The statistical analysis conducted on geographies consisting of 111,162,820 people shows a moderate positive correlation between the proportion of Immigrants from Latvia and unemployment rate among population between the ages 16 and 19 in the United States with a correlation coefficient (R) of 0.409 and weighted average of 16.8%. Similarly, the statistical analysis conducted on geographies consisting of 114,687,942 people shows a mild negative correlation between the proportion of Immigrants from Lithuania and unemployment rate among population between the ages 16 and 19 in the United States with a correlation coefficient (R) of -0.317 and weighted average of 17.0%, a difference of 0.92%.
Unemployment Among Ages 16 to 19 years Correlation Summary
| Measurement | Immigrants from Latvia | Immigrants from Lithuania |
| Minimum | 1.1% | 4.3% |
| Maximum | 81.8% | 41.8% |
| Range | 80.7% | 37.5% |
| Mean | 20.6% | 16.6% |
| Median | 15.8% | 15.0% |
| Interquartile 25% (IQ1) | 9.8% | 9.7% |
| Interquartile 75% (IQ3) | 18.4% | 18.8% |
| Interquartile Range (IQR) | 8.6% | 9.1% |
| Standard Deviation (Sample) | 19.1% | 9.6% |
| Standard Deviation (Population) | 18.7% | 9.4% |
Demographics Similar to Immigrants from Latvia and Immigrants from Lithuania by Unemployment Among Ages 16 to 19 years
In terms of unemployment among ages 16 to 19 years, the demographic groups most similar to Immigrants from Latvia are French Canadian (16.8%, a difference of 0.0%), White/Caucasian (16.8%, a difference of 0.010%), Ugandan (16.8%, a difference of 0.020%), French (16.8%, a difference of 0.060%), and Immigrants from Kuwait (16.8%, a difference of 0.13%). Similarly, the demographic groups most similar to Immigrants from Lithuania are Burmese (17.0%, a difference of 0.020%), Immigrants from Thailand (17.0%, a difference of 0.040%), Immigrants from Venezuela (16.9%, a difference of 0.12%), Ottawa (16.9%, a difference of 0.15%), and Mongolian (16.9%, a difference of 0.18%).
| Demographics | Rating | Rank | Unemployment Among Ages 16 to 19 years |
| French Canadians | 97.5 /100 | #80 | Exceptional 16.8% |
| Immigrants | Latvia | 97.5 /100 | #81 | Exceptional 16.8% |
| Whites/Caucasians | 97.5 /100 | #82 | Exceptional 16.8% |
| Ugandans | 97.4 /100 | #83 | Exceptional 16.8% |
| French | 97.4 /100 | #84 | Exceptional 16.8% |
| Immigrants | Kuwait | 97.2 /100 | #85 | Exceptional 16.8% |
| Immigrants | Scotland | 97.2 /100 | #86 | Exceptional 16.8% |
| Greeks | 97.0 /100 | #87 | Exceptional 16.9% |
| Immigrants | South Africa | 96.9 /100 | #88 | Exceptional 16.9% |
| Canadians | 96.7 /100 | #89 | Exceptional 16.9% |
| Asians | 96.6 /100 | #90 | Exceptional 16.9% |
| Cambodians | 96.3 /100 | #91 | Exceptional 16.9% |
| South Africans | 95.9 /100 | #92 | Exceptional 16.9% |
| Cubans | 95.8 /100 | #93 | Exceptional 16.9% |
| Bangladeshis | 95.8 /100 | #94 | Exceptional 16.9% |
| Mongolians | 95.6 /100 | #95 | Exceptional 16.9% |
| Ottawa | 95.4 /100 | #96 | Exceptional 16.9% |
| Immigrants | Venezuela | 95.3 /100 | #97 | Exceptional 16.9% |
| Burmese | 95.0 /100 | #98 | Exceptional 17.0% |
| Immigrants | Lithuania | 94.9 /100 | #99 | Exceptional 17.0% |
| Immigrants | Thailand | 94.7 /100 | #100 | Exceptional 17.0% |