Immigrants from Laos vs Inupiat Unemployment Among Ages 60 to 64 years
COMPARE
Immigrants from Laos
Inupiat
Unemployment Among Ages 60 to 64 years
Unemployment Among Ages 60 to 64 years Comparison
Immigrants from Laos
Inupiat
4.6%
UNEMPLOYMENT AMONG AGES 60 TO 64 YEARS
99.6/ 100
METRIC RATING
68th/ 347
METRIC RANK
9.6%
UNEMPLOYMENT AMONG AGES 60 TO 64 YEARS
0.0/ 100
METRIC RATING
346th/ 347
METRIC RANK
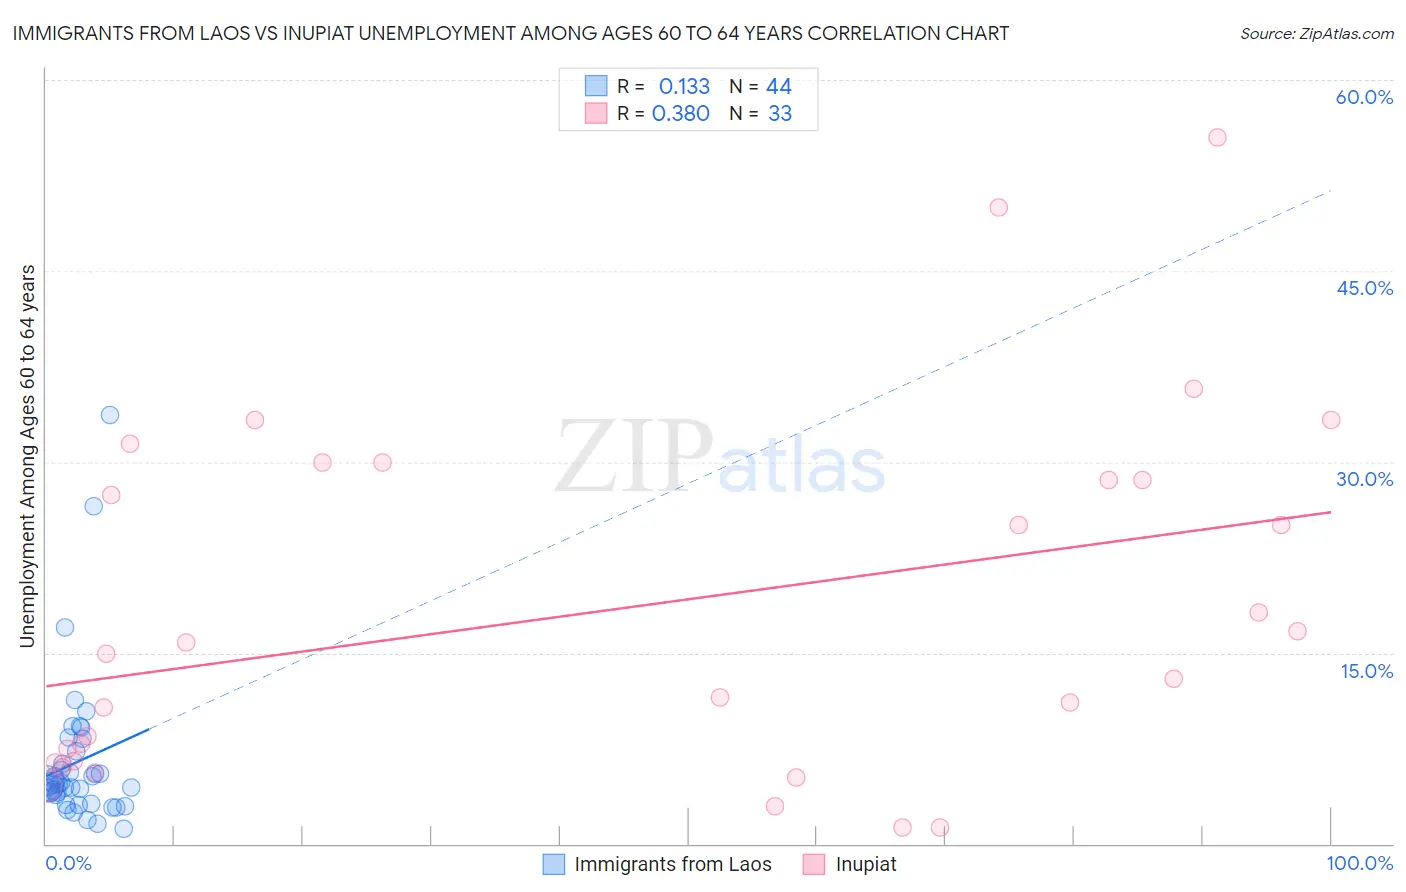
Immigrants from Laos vs Inupiat Unemployment Among Ages 60 to 64 years Correlation Chart
The statistical analysis conducted on geographies consisting of 190,155,317 people shows a poor positive correlation between the proportion of Immigrants from Laos and unemployment rate among population between the ages 60 and 64 in the United States with a correlation coefficient (R) of 0.133 and weighted average of 4.6%. Similarly, the statistical analysis conducted on geographies consisting of 92,796,464 people shows a mild positive correlation between the proportion of Inupiat and unemployment rate among population between the ages 60 and 64 in the United States with a correlation coefficient (R) of 0.380 and weighted average of 9.6%, a difference of 107.3%.
Unemployment Among Ages 60 to 64 years Correlation Summary
| Measurement | Immigrants from Laos | Inupiat |
| Minimum | 1.2% | 1.3% |
| Maximum | 33.7% | 55.5% |
| Range | 32.5% | 54.2% |
| Mean | 6.4% | 18.5% |
| Median | 4.6% | 14.9% |
| Interquartile 25% (IQ1) | 3.4% | 6.5% |
| Interquartile 75% (IQ3) | 6.7% | 29.3% |
| Interquartile Range (IQR) | 3.3% | 22.8% |
| Standard Deviation (Sample) | 6.0% | 14.0% |
| Standard Deviation (Population) | 6.0% | 13.8% |
Similar Demographics by Unemployment Among Ages 60 to 64 years
Demographics Similar to Immigrants from Laos by Unemployment Among Ages 60 to 64 years
In terms of unemployment among ages 60 to 64 years, the demographic groups most similar to Immigrants from Laos are Immigrants from Scotland (4.6%, a difference of 0.030%), Hawaiian (4.6%, a difference of 0.050%), Creek (4.6%, a difference of 0.10%), Croatian (4.6%, a difference of 0.18%), and Jordanian (4.6%, a difference of 0.26%).
| Demographics | Rating | Rank | Unemployment Among Ages 60 to 64 years |
| Lebanese | 99.8 /100 | #61 | Exceptional 4.6% |
| Senegalese | 99.7 /100 | #62 | Exceptional 4.6% |
| Czechoslovakians | 99.7 /100 | #63 | Exceptional 4.6% |
| Immigrants | Middle Africa | 99.7 /100 | #64 | Exceptional 4.6% |
| Jordanians | 99.7 /100 | #65 | Exceptional 4.6% |
| Hawaiians | 99.6 /100 | #66 | Exceptional 4.6% |
| Immigrants | Scotland | 99.6 /100 | #67 | Exceptional 4.6% |
| Immigrants | Laos | 99.6 /100 | #68 | Exceptional 4.6% |
| Creek | 99.6 /100 | #69 | Exceptional 4.6% |
| Croatians | 99.5 /100 | #70 | Exceptional 4.6% |
| Slavs | 99.5 /100 | #71 | Exceptional 4.6% |
| Tongans | 99.5 /100 | #72 | Exceptional 4.6% |
| Immigrants | Eastern Africa | 99.5 /100 | #73 | Exceptional 4.6% |
| Northern Europeans | 99.3 /100 | #74 | Exceptional 4.6% |
| Potawatomi | 99.3 /100 | #75 | Exceptional 4.6% |
Demographics Similar to Inupiat by Unemployment Among Ages 60 to 64 years
In terms of unemployment among ages 60 to 64 years, the demographic groups most similar to Inupiat are Alaskan Athabascan (8.4%, a difference of 14.2%), Yup'ik (11.9%, a difference of 24.4%), Alaska Native (7.6%, a difference of 25.6%), Immigrants from Yemen (6.8%, a difference of 40.3%), and Aleut (6.8%, a difference of 41.3%).
| Demographics | Rating | Rank | Unemployment Among Ages 60 to 64 years |
| Immigrants | Dominican Republic | 0.0 /100 | #333 | Tragic 6.0% |
| Puerto Ricans | 0.0 /100 | #334 | Tragic 6.1% |
| Vietnamese | 0.0 /100 | #335 | Tragic 6.1% |
| Kiowa | 0.0 /100 | #336 | Tragic 6.2% |
| Navajo | 0.0 /100 | #337 | Tragic 6.3% |
| Arapaho | 0.0 /100 | #338 | Tragic 6.3% |
| Tlingit-Haida | 0.0 /100 | #339 | Tragic 6.4% |
| Pueblo | 0.0 /100 | #340 | Tragic 6.7% |
| Yuman | 0.0 /100 | #341 | Tragic 6.8% |
| Aleuts | 0.0 /100 | #342 | Tragic 6.8% |
| Immigrants | Yemen | 0.0 /100 | #343 | Tragic 6.8% |
| Alaska Natives | 0.0 /100 | #344 | Tragic 7.6% |
| Alaskan Athabascans | 0.0 /100 | #345 | Tragic 8.4% |
| Inupiat | 0.0 /100 | #346 | Tragic 9.6% |
| Yup'ik | 0.0 /100 | #347 | Tragic 11.9% |