Trinidadian and Tobagonian vs Inupiat Unemployment Among Ages 60 to 64 years
COMPARE
Trinidadian and Tobagonian
Inupiat
Unemployment Among Ages 60 to 64 years
Unemployment Among Ages 60 to 64 years Comparison
Trinidadians and Tobagonians
Inupiat
5.3%
UNEMPLOYMENT AMONG AGES 60 TO 64 YEARS
0.0/ 100
METRIC RATING
288th/ 347
METRIC RANK
9.6%
UNEMPLOYMENT AMONG AGES 60 TO 64 YEARS
0.0/ 100
METRIC RATING
346th/ 347
METRIC RANK
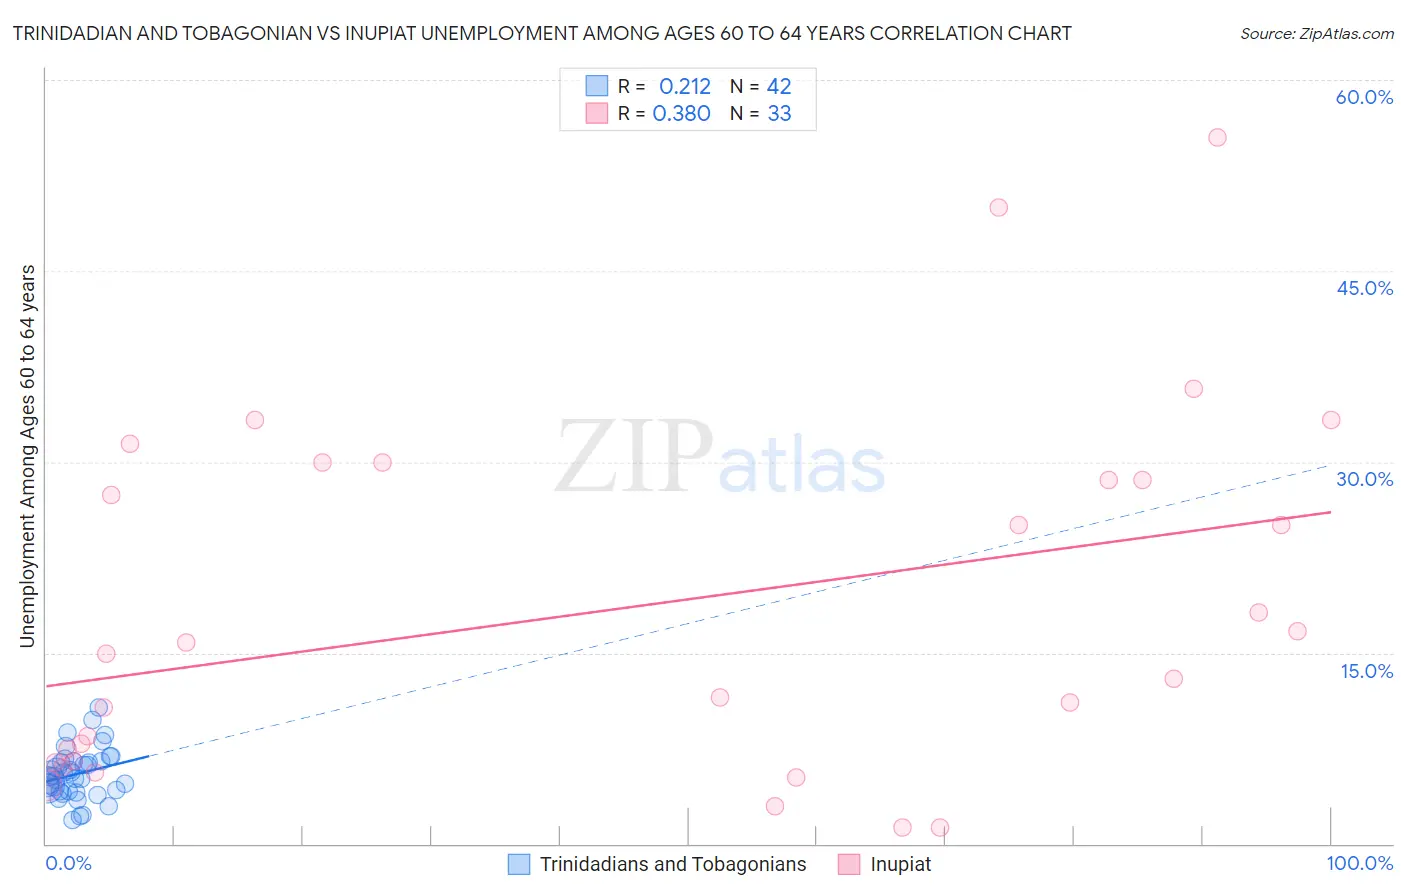
Trinidadian and Tobagonian vs Inupiat Unemployment Among Ages 60 to 64 years Correlation Chart
The statistical analysis conducted on geographies consisting of 208,669,176 people shows a weak positive correlation between the proportion of Trinidadians and Tobagonians and unemployment rate among population between the ages 60 and 64 in the United States with a correlation coefficient (R) of 0.212 and weighted average of 5.3%. Similarly, the statistical analysis conducted on geographies consisting of 92,796,464 people shows a mild positive correlation between the proportion of Inupiat and unemployment rate among population between the ages 60 and 64 in the United States with a correlation coefficient (R) of 0.380 and weighted average of 9.6%, a difference of 81.1%.
Unemployment Among Ages 60 to 64 years Correlation Summary
| Measurement | Trinidadian and Tobagonian | Inupiat |
| Minimum | 1.9% | 1.3% |
| Maximum | 10.7% | 55.5% |
| Range | 8.8% | 54.2% |
| Mean | 5.5% | 18.5% |
| Median | 5.3% | 14.9% |
| Interquartile 25% (IQ1) | 4.1% | 6.5% |
| Interquartile 75% (IQ3) | 6.5% | 29.3% |
| Interquartile Range (IQR) | 2.4% | 22.8% |
| Standard Deviation (Sample) | 1.9% | 14.0% |
| Standard Deviation (Population) | 1.9% | 13.8% |
Similar Demographics by Unemployment Among Ages 60 to 64 years
Demographics Similar to Trinidadians and Tobagonians by Unemployment Among Ages 60 to 64 years
In terms of unemployment among ages 60 to 64 years, the demographic groups most similar to Trinidadians and Tobagonians are Spanish American (5.3%, a difference of 0.030%), Immigrants from Trinidad and Tobago (5.3%, a difference of 0.060%), Salvadoran (5.3%, a difference of 0.18%), Mexican American Indian (5.3%, a difference of 0.22%), and West Indian (5.3%, a difference of 0.33%).
| Demographics | Rating | Rank | Unemployment Among Ages 60 to 64 years |
| Immigrants | Haiti | 0.0 /100 | #281 | Tragic 5.2% |
| Mexicans | 0.0 /100 | #282 | Tragic 5.2% |
| Immigrants | Guatemala | 0.0 /100 | #283 | Tragic 5.3% |
| Taiwanese | 0.0 /100 | #284 | Tragic 5.3% |
| West Indians | 0.0 /100 | #285 | Tragic 5.3% |
| Mexican American Indians | 0.0 /100 | #286 | Tragic 5.3% |
| Salvadorans | 0.0 /100 | #287 | Tragic 5.3% |
| Trinidadians and Tobagonians | 0.0 /100 | #288 | Tragic 5.3% |
| Spanish Americans | 0.0 /100 | #289 | Tragic 5.3% |
| Immigrants | Trinidad and Tobago | 0.0 /100 | #290 | Tragic 5.3% |
| Hispanics or Latinos | 0.0 /100 | #291 | Tragic 5.3% |
| Immigrants | Latin America | 0.0 /100 | #292 | Tragic 5.3% |
| Immigrants | Israel | 0.0 /100 | #293 | Tragic 5.3% |
| Blacks/African Americans | 0.0 /100 | #294 | Tragic 5.3% |
| Armenians | 0.0 /100 | #295 | Tragic 5.3% |
Demographics Similar to Inupiat by Unemployment Among Ages 60 to 64 years
In terms of unemployment among ages 60 to 64 years, the demographic groups most similar to Inupiat are Alaskan Athabascan (8.4%, a difference of 14.2%), Yup'ik (11.9%, a difference of 24.4%), Alaska Native (7.6%, a difference of 25.6%), Immigrants from Yemen (6.8%, a difference of 40.3%), and Aleut (6.8%, a difference of 41.3%).
| Demographics | Rating | Rank | Unemployment Among Ages 60 to 64 years |
| Immigrants | Dominican Republic | 0.0 /100 | #333 | Tragic 6.0% |
| Puerto Ricans | 0.0 /100 | #334 | Tragic 6.1% |
| Vietnamese | 0.0 /100 | #335 | Tragic 6.1% |
| Kiowa | 0.0 /100 | #336 | Tragic 6.2% |
| Navajo | 0.0 /100 | #337 | Tragic 6.3% |
| Arapaho | 0.0 /100 | #338 | Tragic 6.3% |
| Tlingit-Haida | 0.0 /100 | #339 | Tragic 6.4% |
| Pueblo | 0.0 /100 | #340 | Tragic 6.7% |
| Yuman | 0.0 /100 | #341 | Tragic 6.8% |
| Aleuts | 0.0 /100 | #342 | Tragic 6.8% |
| Immigrants | Yemen | 0.0 /100 | #343 | Tragic 6.8% |
| Alaska Natives | 0.0 /100 | #344 | Tragic 7.6% |
| Alaskan Athabascans | 0.0 /100 | #345 | Tragic 8.4% |
| Inupiat | 0.0 /100 | #346 | Tragic 9.6% |
| Yup'ik | 0.0 /100 | #347 | Tragic 11.9% |