Immigrants from Laos vs Salvadoran Unemployment Among Ages 60 to 64 years
COMPARE
Immigrants from Laos
Salvadoran
Unemployment Among Ages 60 to 64 years
Unemployment Among Ages 60 to 64 years Comparison
Immigrants from Laos
Salvadorans
4.6%
UNEMPLOYMENT AMONG AGES 60 TO 64 YEARS
99.6/ 100
METRIC RATING
68th/ 347
METRIC RANK
5.3%
UNEMPLOYMENT AMONG AGES 60 TO 64 YEARS
0.0/ 100
METRIC RATING
287th/ 347
METRIC RANK
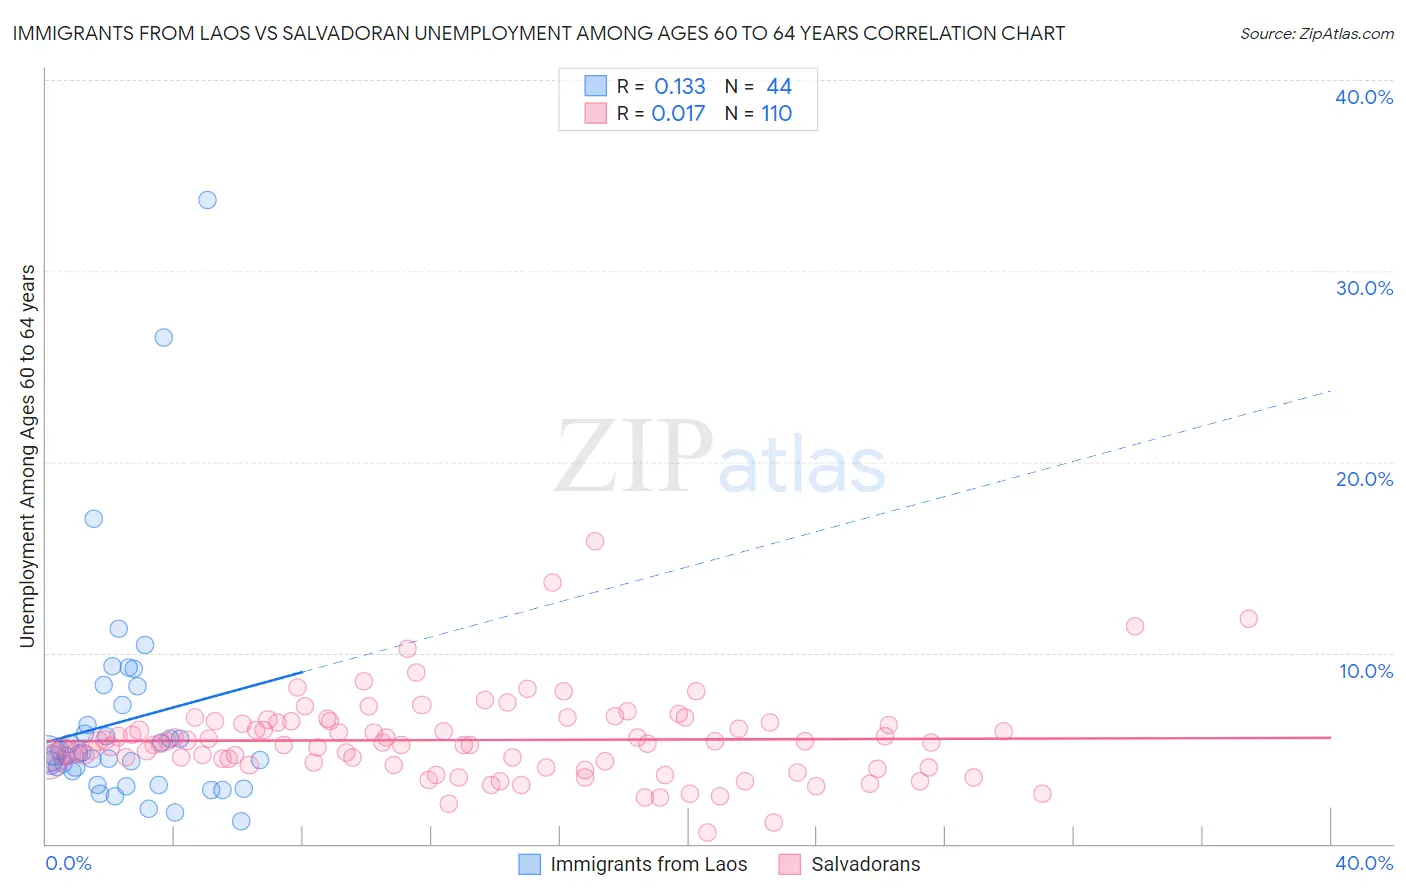
Immigrants from Laos vs Salvadoran Unemployment Among Ages 60 to 64 years Correlation Chart
The statistical analysis conducted on geographies consisting of 190,155,317 people shows a poor positive correlation between the proportion of Immigrants from Laos and unemployment rate among population between the ages 60 and 64 in the United States with a correlation coefficient (R) of 0.133 and weighted average of 4.6%. Similarly, the statistical analysis conducted on geographies consisting of 361,963,787 people shows no correlation between the proportion of Salvadorans and unemployment rate among population between the ages 60 and 64 in the United States with a correlation coefficient (R) of 0.017 and weighted average of 5.3%, a difference of 14.3%.
Unemployment Among Ages 60 to 64 years Correlation Summary
| Measurement | Immigrants from Laos | Salvadoran |
| Minimum | 1.2% | 0.57% |
| Maximum | 33.7% | 15.8% |
| Range | 32.5% | 15.3% |
| Mean | 6.4% | 5.4% |
| Median | 4.6% | 5.3% |
| Interquartile 25% (IQ1) | 3.4% | 4.2% |
| Interquartile 75% (IQ3) | 6.7% | 6.4% |
| Interquartile Range (IQR) | 3.3% | 2.2% |
| Standard Deviation (Sample) | 6.0% | 2.2% |
| Standard Deviation (Population) | 6.0% | 2.2% |
Similar Demographics by Unemployment Among Ages 60 to 64 years
Demographics Similar to Immigrants from Laos by Unemployment Among Ages 60 to 64 years
In terms of unemployment among ages 60 to 64 years, the demographic groups most similar to Immigrants from Laos are Immigrants from Scotland (4.6%, a difference of 0.030%), Hawaiian (4.6%, a difference of 0.050%), Creek (4.6%, a difference of 0.10%), Croatian (4.6%, a difference of 0.18%), and Jordanian (4.6%, a difference of 0.26%).
| Demographics | Rating | Rank | Unemployment Among Ages 60 to 64 years |
| Lebanese | 99.8 /100 | #61 | Exceptional 4.6% |
| Senegalese | 99.7 /100 | #62 | Exceptional 4.6% |
| Czechoslovakians | 99.7 /100 | #63 | Exceptional 4.6% |
| Immigrants | Middle Africa | 99.7 /100 | #64 | Exceptional 4.6% |
| Jordanians | 99.7 /100 | #65 | Exceptional 4.6% |
| Hawaiians | 99.6 /100 | #66 | Exceptional 4.6% |
| Immigrants | Scotland | 99.6 /100 | #67 | Exceptional 4.6% |
| Immigrants | Laos | 99.6 /100 | #68 | Exceptional 4.6% |
| Creek | 99.6 /100 | #69 | Exceptional 4.6% |
| Croatians | 99.5 /100 | #70 | Exceptional 4.6% |
| Slavs | 99.5 /100 | #71 | Exceptional 4.6% |
| Tongans | 99.5 /100 | #72 | Exceptional 4.6% |
| Immigrants | Eastern Africa | 99.5 /100 | #73 | Exceptional 4.6% |
| Northern Europeans | 99.3 /100 | #74 | Exceptional 4.6% |
| Potawatomi | 99.3 /100 | #75 | Exceptional 4.6% |
Demographics Similar to Salvadorans by Unemployment Among Ages 60 to 64 years
In terms of unemployment among ages 60 to 64 years, the demographic groups most similar to Salvadorans are Mexican American Indian (5.3%, a difference of 0.040%), West Indian (5.3%, a difference of 0.15%), Trinidadian and Tobagonian (5.3%, a difference of 0.18%), Spanish American (5.3%, a difference of 0.21%), and Immigrants from Trinidad and Tobago (5.3%, a difference of 0.24%).
| Demographics | Rating | Rank | Unemployment Among Ages 60 to 64 years |
| French American Indians | 0.0 /100 | #280 | Tragic 5.2% |
| Immigrants | Haiti | 0.0 /100 | #281 | Tragic 5.2% |
| Mexicans | 0.0 /100 | #282 | Tragic 5.2% |
| Immigrants | Guatemala | 0.0 /100 | #283 | Tragic 5.3% |
| Taiwanese | 0.0 /100 | #284 | Tragic 5.3% |
| West Indians | 0.0 /100 | #285 | Tragic 5.3% |
| Mexican American Indians | 0.0 /100 | #286 | Tragic 5.3% |
| Salvadorans | 0.0 /100 | #287 | Tragic 5.3% |
| Trinidadians and Tobagonians | 0.0 /100 | #288 | Tragic 5.3% |
| Spanish Americans | 0.0 /100 | #289 | Tragic 5.3% |
| Immigrants | Trinidad and Tobago | 0.0 /100 | #290 | Tragic 5.3% |
| Hispanics or Latinos | 0.0 /100 | #291 | Tragic 5.3% |
| Immigrants | Latin America | 0.0 /100 | #292 | Tragic 5.3% |
| Immigrants | Israel | 0.0 /100 | #293 | Tragic 5.3% |
| Blacks/African Americans | 0.0 /100 | #294 | Tragic 5.3% |