Immigrants from Kuwait vs Slovene Disability Age Under 5
COMPARE
Immigrants from Kuwait
Slovene
Disability Age Under 5
Disability Age Under 5 Comparison
Immigrants from Kuwait
Slovenes
1.2%
DISABILITY AGE UNDER 5
62.6/ 100
METRIC RATING
165th/ 347
METRIC RANK
1.4%
DISABILITY AGE UNDER 5
0.3/ 100
METRIC RATING
257th/ 347
METRIC RANK
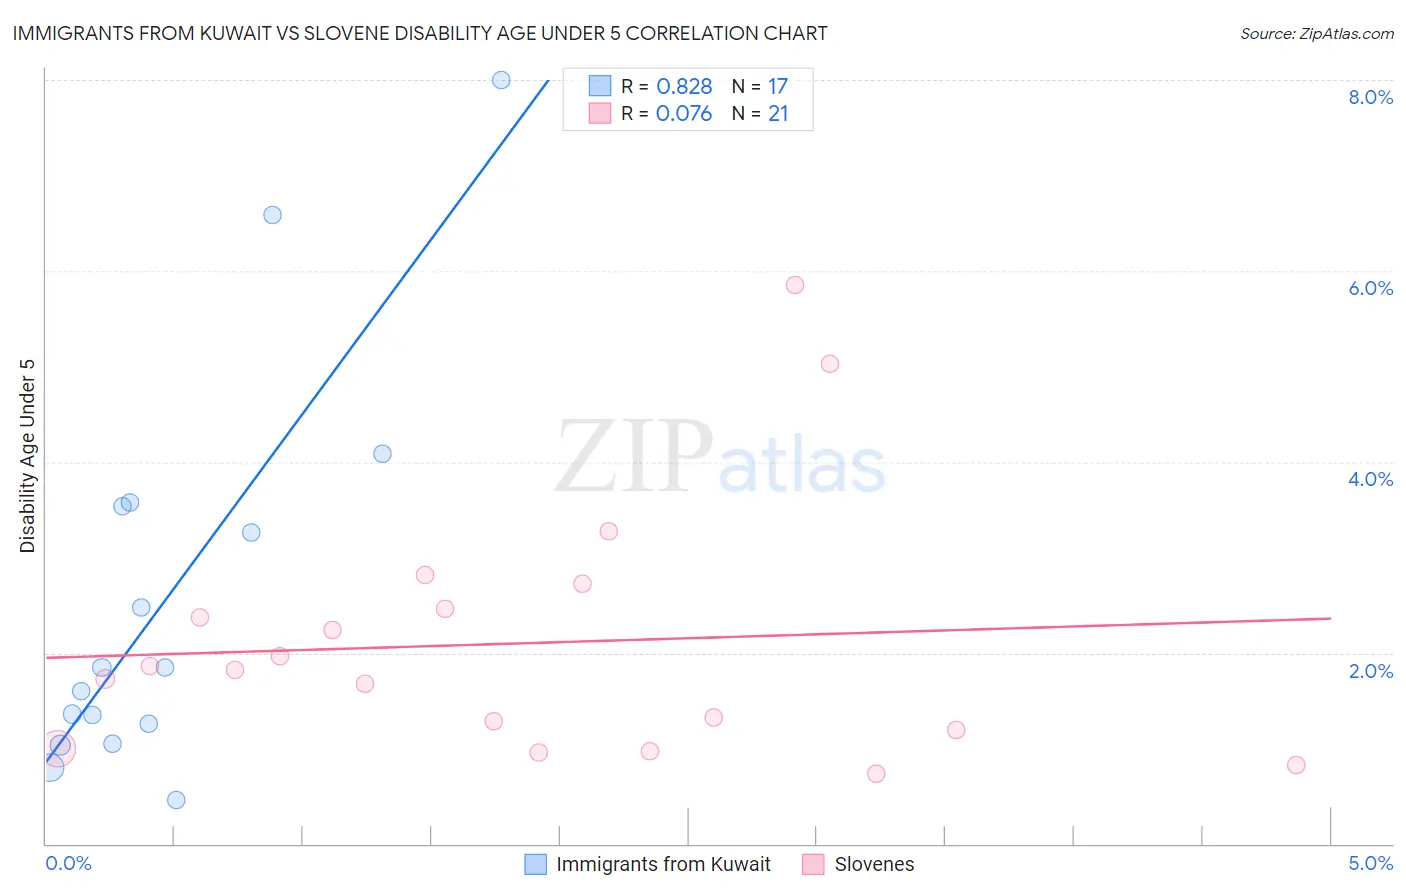
Immigrants from Kuwait vs Slovene Disability Age Under 5 Correlation Chart
The statistical analysis conducted on geographies consisting of 100,801,257 people shows a very strong positive correlation between the proportion of Immigrants from Kuwait and percentage of population with a disability under the age of 5 in the United States with a correlation coefficient (R) of 0.828 and weighted average of 1.2%. Similarly, the statistical analysis conducted on geographies consisting of 155,245,072 people shows a slight positive correlation between the proportion of Slovenes and percentage of population with a disability under the age of 5 in the United States with a correlation coefficient (R) of 0.076 and weighted average of 1.4%, a difference of 14.2%.
Disability Age Under 5 Correlation Summary
| Measurement | Immigrants from Kuwait | Slovene |
| Minimum | 0.45% | 0.73% |
| Maximum | 8.0% | 5.9% |
| Range | 7.5% | 5.1% |
| Mean | 2.6% | 2.1% |
| Median | 1.8% | 1.8% |
| Interquartile 25% (IQ1) | 1.1% | 1.1% |
| Interquartile 75% (IQ3) | 3.6% | 2.6% |
| Interquartile Range (IQR) | 2.4% | 1.5% |
| Standard Deviation (Sample) | 2.1% | 1.3% |
| Standard Deviation (Population) | 2.0% | 1.3% |
Similar Demographics by Disability Age Under 5
Demographics Similar to Immigrants from Kuwait by Disability Age Under 5
In terms of disability age under 5, the demographic groups most similar to Immigrants from Kuwait are Laotian (1.2%, a difference of 0.020%), Immigrants from Guatemala (1.2%, a difference of 0.070%), Guatemalan (1.2%, a difference of 0.10%), Immigrants from Central America (1.2%, a difference of 0.11%), and Immigrants from Argentina (1.2%, a difference of 0.22%).
| Demographics | Rating | Rank | Disability Age Under 5 |
| Arabs | 66.4 /100 | #158 | Good 1.2% |
| Colombians | 65.8 /100 | #159 | Good 1.2% |
| Immigrants | Latin America | 65.8 /100 | #160 | Good 1.2% |
| Immigrants | Africa | 65.1 /100 | #161 | Good 1.2% |
| Guatemalans | 63.6 /100 | #162 | Good 1.2% |
| Immigrants | Guatemala | 63.2 /100 | #163 | Good 1.2% |
| Laotians | 62.8 /100 | #164 | Good 1.2% |
| Immigrants | Kuwait | 62.6 /100 | #165 | Good 1.2% |
| Immigrants | Central America | 61.4 /100 | #166 | Good 1.2% |
| Immigrants | Argentina | 60.2 /100 | #167 | Good 1.2% |
| Sierra Leoneans | 59.1 /100 | #168 | Average 1.2% |
| Immigrants | Uruguay | 59.0 /100 | #169 | Average 1.2% |
| Immigrants | Jamaica | 58.8 /100 | #170 | Average 1.2% |
| Guamanians/Chamorros | 57.8 /100 | #171 | Average 1.2% |
| Crow | 51.0 /100 | #172 | Average 1.2% |
Demographics Similar to Slovenes by Disability Age Under 5
In terms of disability age under 5, the demographic groups most similar to Slovenes are Costa Rican (1.4%, a difference of 0.19%), Immigrants from Southern Europe (1.4%, a difference of 0.34%), Slavic (1.4%, a difference of 0.55%), Immigrants from Western Europe (1.4%, a difference of 0.89%), and Immigrants from Netherlands (1.4%, a difference of 1.2%).
| Demographics | Rating | Rank | Disability Age Under 5 |
| Africans | 1.0 /100 | #250 | Tragic 1.4% |
| Immigrants | Hungary | 1.0 /100 | #251 | Tragic 1.4% |
| Immigrants | Scotland | 0.9 /100 | #252 | Tragic 1.4% |
| Australians | 0.7 /100 | #253 | Tragic 1.4% |
| Immigrants | Brazil | 0.7 /100 | #254 | Tragic 1.4% |
| Immigrants | Liberia | 0.6 /100 | #255 | Tragic 1.4% |
| Immigrants | Western Europe | 0.5 /100 | #256 | Tragic 1.4% |
| Slovenes | 0.3 /100 | #257 | Tragic 1.4% |
| Costa Ricans | 0.3 /100 | #258 | Tragic 1.4% |
| Immigrants | Southern Europe | 0.3 /100 | #259 | Tragic 1.4% |
| Slavs | 0.3 /100 | #260 | Tragic 1.4% |
| Immigrants | Netherlands | 0.2 /100 | #261 | Tragic 1.4% |
| Immigrants | Dominica | 0.2 /100 | #262 | Tragic 1.4% |
| Spanish | 0.2 /100 | #263 | Tragic 1.4% |
| Yugoslavians | 0.1 /100 | #264 | Tragic 1.4% |