Immigrants from Kuwait vs Central American Unemployment Among Ages 60 to 64 years
COMPARE
Immigrants from Kuwait
Central American
Unemployment Among Ages 60 to 64 years
Unemployment Among Ages 60 to 64 years Comparison
Immigrants from Kuwait
Central Americans
4.7%
UNEMPLOYMENT AMONG AGES 60 TO 64 YEARS
98.3/ 100
METRIC RATING
94th/ 347
METRIC RANK
5.2%
UNEMPLOYMENT AMONG AGES 60 TO 64 YEARS
0.0/ 100
METRIC RATING
276th/ 347
METRIC RANK
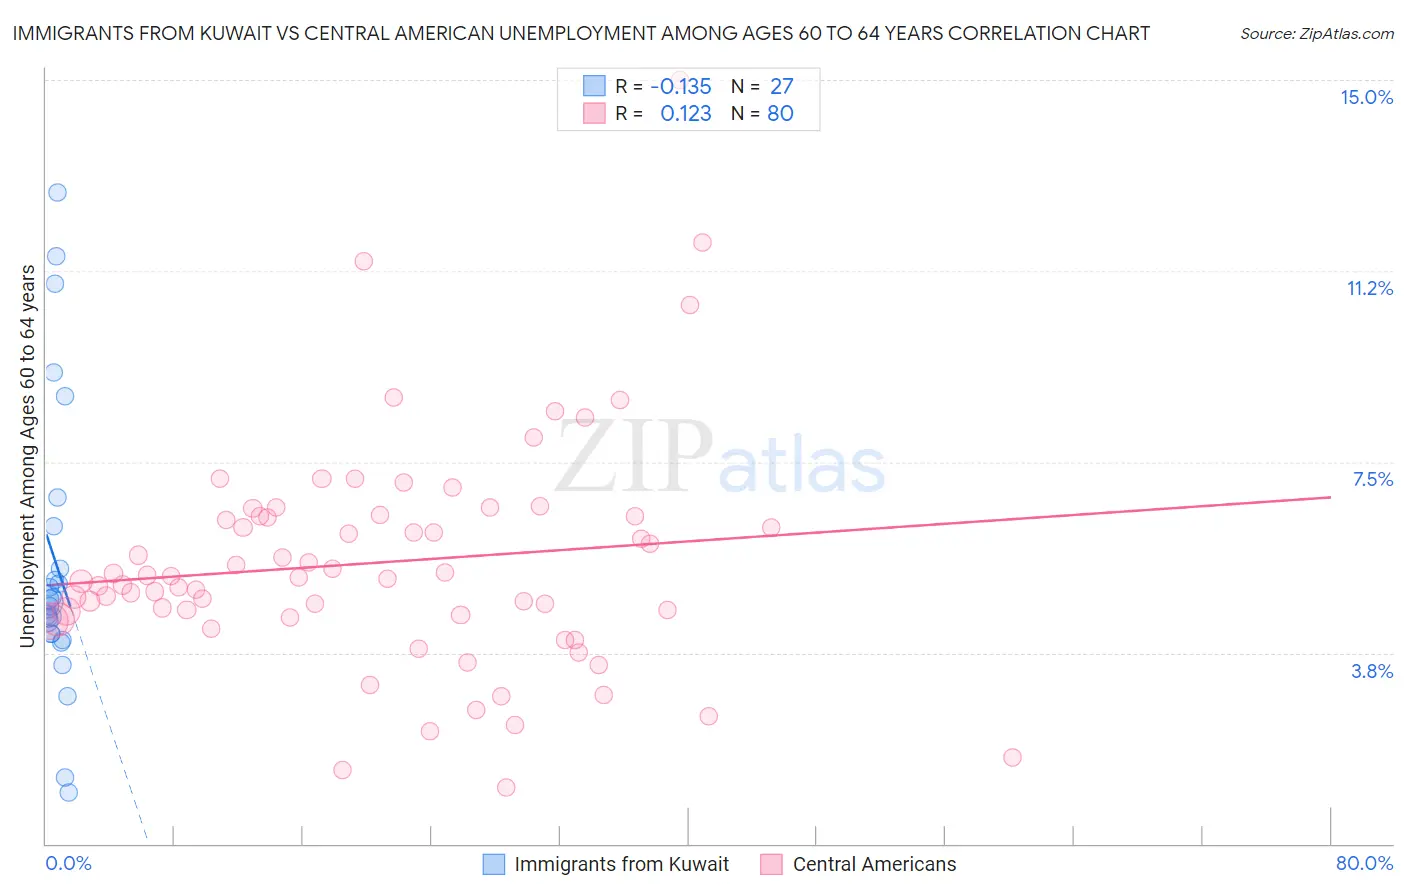
Immigrants from Kuwait vs Central American Unemployment Among Ages 60 to 64 years Correlation Chart
The statistical analysis conducted on geographies consisting of 132,594,540 people shows a poor negative correlation between the proportion of Immigrants from Kuwait and unemployment rate among population between the ages 60 and 64 in the United States with a correlation coefficient (R) of -0.135 and weighted average of 4.7%. Similarly, the statistical analysis conducted on geographies consisting of 436,480,787 people shows a poor positive correlation between the proportion of Central Americans and unemployment rate among population between the ages 60 and 64 in the United States with a correlation coefficient (R) of 0.123 and weighted average of 5.2%, a difference of 10.8%.
Unemployment Among Ages 60 to 64 years Correlation Summary
| Measurement | Immigrants from Kuwait | Central American |
| Minimum | 1.0% | 1.1% |
| Maximum | 12.8% | 15.0% |
| Range | 11.8% | 13.9% |
| Mean | 5.5% | 5.5% |
| Median | 4.8% | 5.2% |
| Interquartile 25% (IQ1) | 4.1% | 4.5% |
| Interquartile 75% (IQ3) | 6.2% | 6.4% |
| Interquartile Range (IQR) | 2.1% | 2.0% |
| Standard Deviation (Sample) | 2.9% | 2.3% |
| Standard Deviation (Population) | 2.8% | 2.2% |
Similar Demographics by Unemployment Among Ages 60 to 64 years
Demographics Similar to Immigrants from Kuwait by Unemployment Among Ages 60 to 64 years
In terms of unemployment among ages 60 to 64 years, the demographic groups most similar to Immigrants from Kuwait are Immigrants from Saudi Arabia (4.7%, a difference of 0.010%), Romanian (4.7%, a difference of 0.030%), Immigrants from Uganda (4.7%, a difference of 0.060%), Serbian (4.7%, a difference of 0.080%), and Polish (4.7%, a difference of 0.090%).
| Demographics | Rating | Rank | Unemployment Among Ages 60 to 64 years |
| Immigrants | Jordan | 98.8 /100 | #87 | Exceptional 4.7% |
| Immigrants | Bulgaria | 98.7 /100 | #88 | Exceptional 4.7% |
| Immigrants | Northern Africa | 98.7 /100 | #89 | Exceptional 4.7% |
| Immigrants | Liberia | 98.7 /100 | #90 | Exceptional 4.7% |
| Immigrants | Uganda | 98.4 /100 | #91 | Exceptional 4.7% |
| Romanians | 98.4 /100 | #92 | Exceptional 4.7% |
| Immigrants | Saudi Arabia | 98.3 /100 | #93 | Exceptional 4.7% |
| Immigrants | Kuwait | 98.3 /100 | #94 | Exceptional 4.7% |
| Serbians | 98.2 /100 | #95 | Exceptional 4.7% |
| Poles | 98.1 /100 | #96 | Exceptional 4.7% |
| Immigrants | Albania | 98.0 /100 | #97 | Exceptional 4.7% |
| Somalis | 98.0 /100 | #98 | Exceptional 4.7% |
| Egyptians | 98.0 /100 | #99 | Exceptional 4.7% |
| Portuguese | 97.9 /100 | #100 | Exceptional 4.7% |
| Malaysians | 97.9 /100 | #101 | Exceptional 4.7% |
Demographics Similar to Central Americans by Unemployment Among Ages 60 to 64 years
In terms of unemployment among ages 60 to 64 years, the demographic groups most similar to Central Americans are Immigrants from Hong Kong (5.2%, a difference of 0.16%), Immigrants from Caribbean (5.2%, a difference of 0.27%), Hopi (5.2%, a difference of 0.30%), Immigrants from Spain (5.2%, a difference of 0.44%), and Haitian (5.2%, a difference of 0.51%).
| Demographics | Rating | Rank | Unemployment Among Ages 60 to 64 years |
| Immigrants | Costa Rica | 0.2 /100 | #269 | Tragic 5.1% |
| Immigrants | Iran | 0.1 /100 | #270 | Tragic 5.1% |
| Israelis | 0.1 /100 | #271 | Tragic 5.2% |
| Haitians | 0.1 /100 | #272 | Tragic 5.2% |
| Immigrants | Spain | 0.1 /100 | #273 | Tragic 5.2% |
| Hopi | 0.1 /100 | #274 | Tragic 5.2% |
| Immigrants | Hong Kong | 0.1 /100 | #275 | Tragic 5.2% |
| Central Americans | 0.0 /100 | #276 | Tragic 5.2% |
| Immigrants | Caribbean | 0.0 /100 | #277 | Tragic 5.2% |
| Guatemalans | 0.0 /100 | #278 | Tragic 5.2% |
| Nepalese | 0.0 /100 | #279 | Tragic 5.2% |
| French American Indians | 0.0 /100 | #280 | Tragic 5.2% |
| Immigrants | Haiti | 0.0 /100 | #281 | Tragic 5.2% |
| Mexicans | 0.0 /100 | #282 | Tragic 5.2% |
| Immigrants | Guatemala | 0.0 /100 | #283 | Tragic 5.3% |