Immigrants from Kuwait vs Serbian Unemployment Among Ages 60 to 64 years
COMPARE
Immigrants from Kuwait
Serbian
Unemployment Among Ages 60 to 64 years
Unemployment Among Ages 60 to 64 years Comparison
Immigrants from Kuwait
Serbians
4.7%
UNEMPLOYMENT AMONG AGES 60 TO 64 YEARS
98.3/ 100
METRIC RATING
94th/ 347
METRIC RANK
4.7%
UNEMPLOYMENT AMONG AGES 60 TO 64 YEARS
98.2/ 100
METRIC RATING
95th/ 347
METRIC RANK
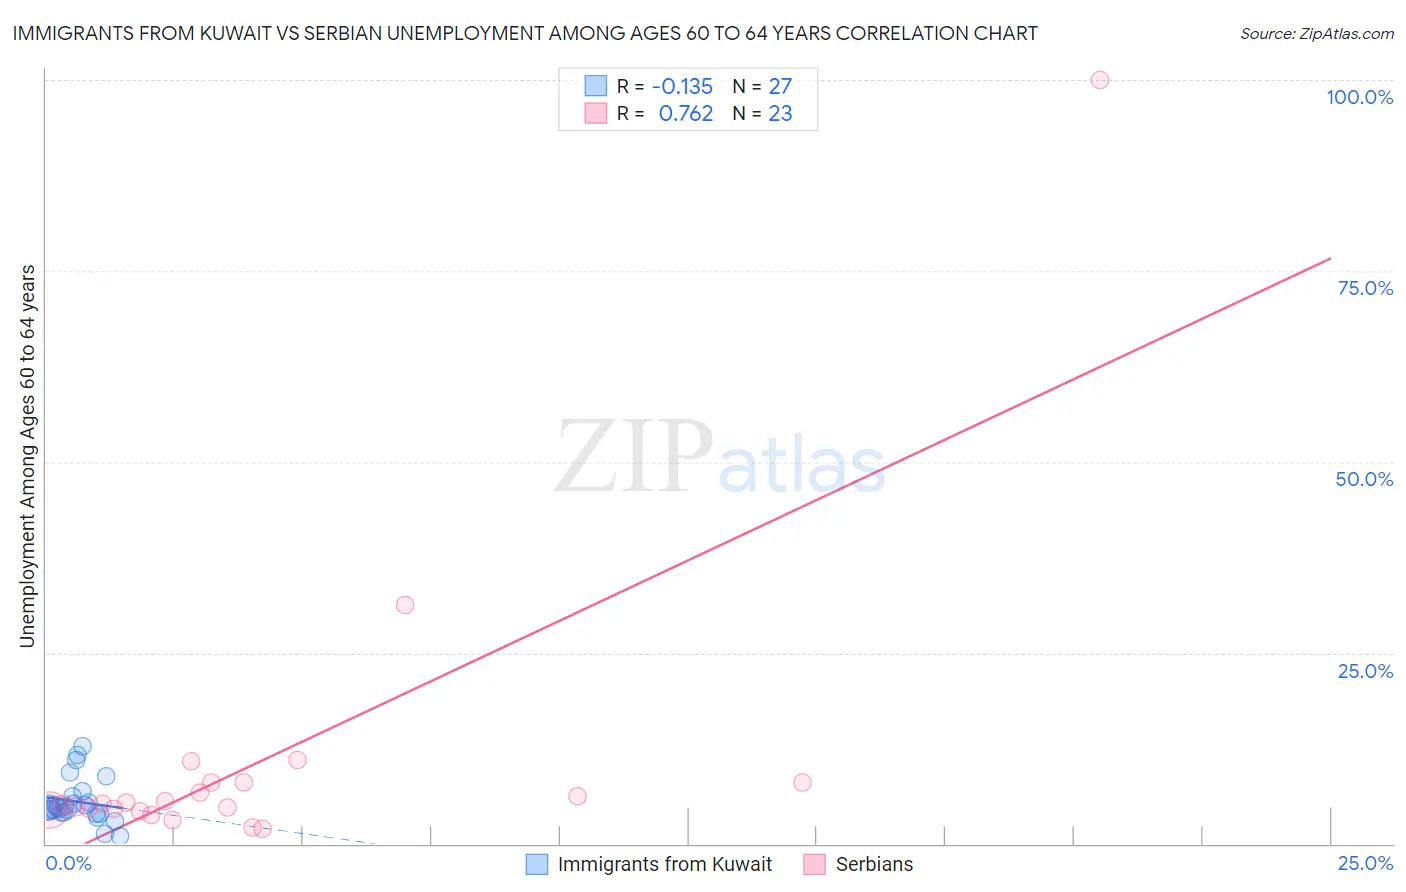
Immigrants from Kuwait vs Serbian Unemployment Among Ages 60 to 64 years Correlation Chart
The statistical analysis conducted on geographies consisting of 132,594,540 people shows a poor negative correlation between the proportion of Immigrants from Kuwait and unemployment rate among population between the ages 60 and 64 in the United States with a correlation coefficient (R) of -0.135 and weighted average of 4.7%. Similarly, the statistical analysis conducted on geographies consisting of 248,507,715 people shows a strong positive correlation between the proportion of Serbians and unemployment rate among population between the ages 60 and 64 in the United States with a correlation coefficient (R) of 0.762 and weighted average of 4.7%, a difference of 0.080%.
Unemployment Among Ages 60 to 64 years Correlation Summary
| Measurement | Immigrants from Kuwait | Serbian |
| Minimum | 1.0% | 1.9% |
| Maximum | 12.8% | 100.0% |
| Range | 11.8% | 98.1% |
| Mean | 5.5% | 10.9% |
| Median | 4.8% | 5.2% |
| Interquartile 25% (IQ1) | 4.1% | 4.5% |
| Interquartile 75% (IQ3) | 6.2% | 8.0% |
| Interquartile Range (IQR) | 2.1% | 3.6% |
| Standard Deviation (Sample) | 2.9% | 20.3% |
| Standard Deviation (Population) | 2.8% | 19.8% |
Demographics Similar to Immigrants from Kuwait and Serbians by Unemployment Among Ages 60 to 64 years
In terms of unemployment among ages 60 to 64 years, the demographic groups most similar to Immigrants from Kuwait are Immigrants from Saudi Arabia (4.7%, a difference of 0.010%), Romanian (4.7%, a difference of 0.030%), Immigrants from Uganda (4.7%, a difference of 0.060%), Polish (4.7%, a difference of 0.090%), and Immigrants from Albania (4.7%, a difference of 0.17%). Similarly, the demographic groups most similar to Serbians are Polish (4.7%, a difference of 0.010%), Immigrants from Saudi Arabia (4.7%, a difference of 0.080%), Romanian (4.7%, a difference of 0.10%), Immigrants from Albania (4.7%, a difference of 0.10%), and Somali (4.7%, a difference of 0.10%).
| Demographics | Rating | Rank | Unemployment Among Ages 60 to 64 years |
| Thais | 98.9 /100 | #84 | Exceptional 4.7% |
| Immigrants | Sri Lanka | 98.9 /100 | #85 | Exceptional 4.7% |
| Immigrants | Oceania | 98.9 /100 | #86 | Exceptional 4.7% |
| Immigrants | Jordan | 98.8 /100 | #87 | Exceptional 4.7% |
| Immigrants | Bulgaria | 98.7 /100 | #88 | Exceptional 4.7% |
| Immigrants | Northern Africa | 98.7 /100 | #89 | Exceptional 4.7% |
| Immigrants | Liberia | 98.7 /100 | #90 | Exceptional 4.7% |
| Immigrants | Uganda | 98.4 /100 | #91 | Exceptional 4.7% |
| Romanians | 98.4 /100 | #92 | Exceptional 4.7% |
| Immigrants | Saudi Arabia | 98.3 /100 | #93 | Exceptional 4.7% |
| Immigrants | Kuwait | 98.3 /100 | #94 | Exceptional 4.7% |
| Serbians | 98.2 /100 | #95 | Exceptional 4.7% |
| Poles | 98.1 /100 | #96 | Exceptional 4.7% |
| Immigrants | Albania | 98.0 /100 | #97 | Exceptional 4.7% |
| Somalis | 98.0 /100 | #98 | Exceptional 4.7% |
| Egyptians | 98.0 /100 | #99 | Exceptional 4.7% |
| Portuguese | 97.9 /100 | #100 | Exceptional 4.7% |
| Malaysians | 97.9 /100 | #101 | Exceptional 4.7% |
| Immigrants | Canada | 97.8 /100 | #102 | Exceptional 4.7% |
| Whites/Caucasians | 97.8 /100 | #103 | Exceptional 4.7% |
| Paraguayans | 97.7 /100 | #104 | Exceptional 4.7% |