Immigrants from Kazakhstan vs Shoshone Male Unemployment
COMPARE
Immigrants from Kazakhstan
Shoshone
Male Unemployment
Male Unemployment Comparison
Immigrants from Kazakhstan
Shoshone
5.3%
MALE UNEMPLOYMENT
50.8/ 100
METRIC RATING
172nd/ 347
METRIC RANK
7.6%
MALE UNEMPLOYMENT
0.0/ 100
METRIC RATING
325th/ 347
METRIC RANK
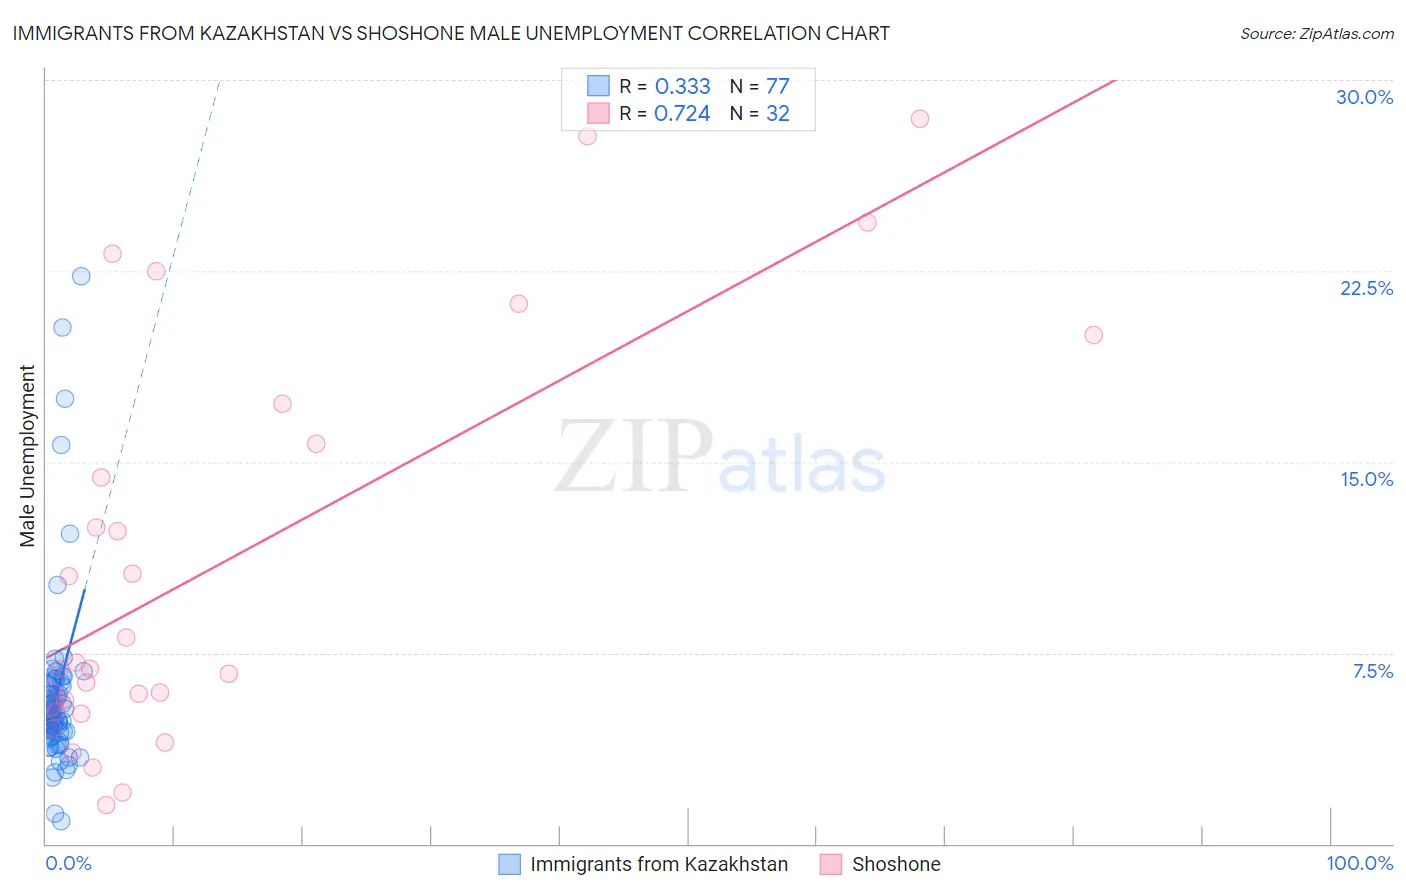
Immigrants from Kazakhstan vs Shoshone Male Unemployment Correlation Chart
The statistical analysis conducted on geographies consisting of 124,296,316 people shows a mild positive correlation between the proportion of Immigrants from Kazakhstan and unemployment rate among males in the United States with a correlation coefficient (R) of 0.333 and weighted average of 5.3%. Similarly, the statistical analysis conducted on geographies consisting of 66,510,535 people shows a strong positive correlation between the proportion of Shoshone and unemployment rate among males in the United States with a correlation coefficient (R) of 0.724 and weighted average of 7.6%, a difference of 43.6%.
Male Unemployment Correlation Summary
| Measurement | Immigrants from Kazakhstan | Shoshone |
| Minimum | 0.90% | 1.5% |
| Maximum | 22.3% | 28.5% |
| Range | 21.4% | 27.0% |
| Mean | 5.8% | 11.1% |
| Median | 5.1% | 7.0% |
| Interquartile 25% (IQ1) | 4.4% | 5.4% |
| Interquartile 75% (IQ3) | 6.2% | 16.5% |
| Interquartile Range (IQR) | 1.8% | 11.1% |
| Standard Deviation (Sample) | 3.5% | 8.0% |
| Standard Deviation (Population) | 3.5% | 7.8% |
Similar Demographics by Male Unemployment
Demographics Similar to Immigrants from Kazakhstan by Male Unemployment
In terms of male unemployment, the demographic groups most similar to Immigrants from Kazakhstan are Immigrants from Russia (5.3%, a difference of 0.010%), Immigrants from Iran (5.3%, a difference of 0.050%), Peruvian (5.3%, a difference of 0.060%), Immigrants from Iraq (5.3%, a difference of 0.16%), and Immigrants from Eastern Europe (5.3%, a difference of 0.19%).
| Demographics | Rating | Rank | Male Unemployment |
| South Americans | 60.6 /100 | #165 | Good 5.3% |
| Immigrants | Morocco | 60.2 /100 | #166 | Good 5.3% |
| Immigrants | Vietnam | 58.1 /100 | #167 | Average 5.3% |
| Immigrants | Ireland | 57.7 /100 | #168 | Average 5.3% |
| Immigrants | Congo | 57.4 /100 | #169 | Average 5.3% |
| Immigrants | Eastern Europe | 54.1 /100 | #170 | Average 5.3% |
| Peruvians | 51.9 /100 | #171 | Average 5.3% |
| Immigrants | Kazakhstan | 50.8 /100 | #172 | Average 5.3% |
| Immigrants | Russia | 50.7 /100 | #173 | Average 5.3% |
| Immigrants | Iran | 50.0 /100 | #174 | Average 5.3% |
| Immigrants | Iraq | 48.1 /100 | #175 | Average 5.3% |
| Immigrants | Poland | 46.0 /100 | #176 | Average 5.3% |
| Immigrants | Peru | 44.6 /100 | #177 | Average 5.3% |
| Osage | 42.5 /100 | #178 | Average 5.3% |
| Immigrants | Oceania | 40.8 /100 | #179 | Average 5.3% |
Demographics Similar to Shoshone by Male Unemployment
In terms of male unemployment, the demographic groups most similar to Shoshone are Immigrants from Dominican Republic (7.6%, a difference of 0.10%), Dominican (7.6%, a difference of 0.37%), Immigrants from Grenada (7.6%, a difference of 0.65%), Paiute (7.7%, a difference of 1.2%), and Immigrants from Cabo Verde (7.5%, a difference of 1.4%).
| Demographics | Rating | Rank | Male Unemployment |
| Cape Verdeans | 0.0 /100 | #318 | Tragic 7.1% |
| British West Indians | 0.0 /100 | #319 | Tragic 7.3% |
| Colville | 0.0 /100 | #320 | Tragic 7.4% |
| Immigrants | St. Vincent and the Grenadines | 0.0 /100 | #321 | Tragic 7.5% |
| Immigrants | Cabo Verde | 0.0 /100 | #322 | Tragic 7.5% |
| Immigrants | Grenada | 0.0 /100 | #323 | Tragic 7.6% |
| Dominicans | 0.0 /100 | #324 | Tragic 7.6% |
| Shoshone | 0.0 /100 | #325 | Tragic 7.6% |
| Immigrants | Dominican Republic | 0.0 /100 | #326 | Tragic 7.6% |
| Paiute | 0.0 /100 | #327 | Tragic 7.7% |
| Natives/Alaskans | 0.0 /100 | #328 | Tragic 7.7% |
| Immigrants | Yemen | 0.0 /100 | #329 | Tragic 7.8% |
| Yakama | 0.0 /100 | #330 | Tragic 7.9% |
| Alaska Natives | 0.0 /100 | #331 | Tragic 8.1% |
| Pima | 0.0 /100 | #332 | Tragic 8.3% |