Immigrants from Kazakhstan vs Mexican American Indian Unemployment Among Women with Children Under 18 years
COMPARE
Immigrants from Kazakhstan
Mexican American Indian
Unemployment Among Women with Children Under 18 years
Unemployment Among Women with Children Under 18 years Comparison
Immigrants from Kazakhstan
Mexican American Indians
5.4%
UNEMPLOYMENT AMONG WOMEN WITH CHILDREN UNDER 18 YEARS
51.7/ 100
METRIC RATING
172nd/ 347
METRIC RANK
6.2%
UNEMPLOYMENT AMONG WOMEN WITH CHILDREN UNDER 18 YEARS
0.0/ 100
METRIC RATING
277th/ 347
METRIC RANK
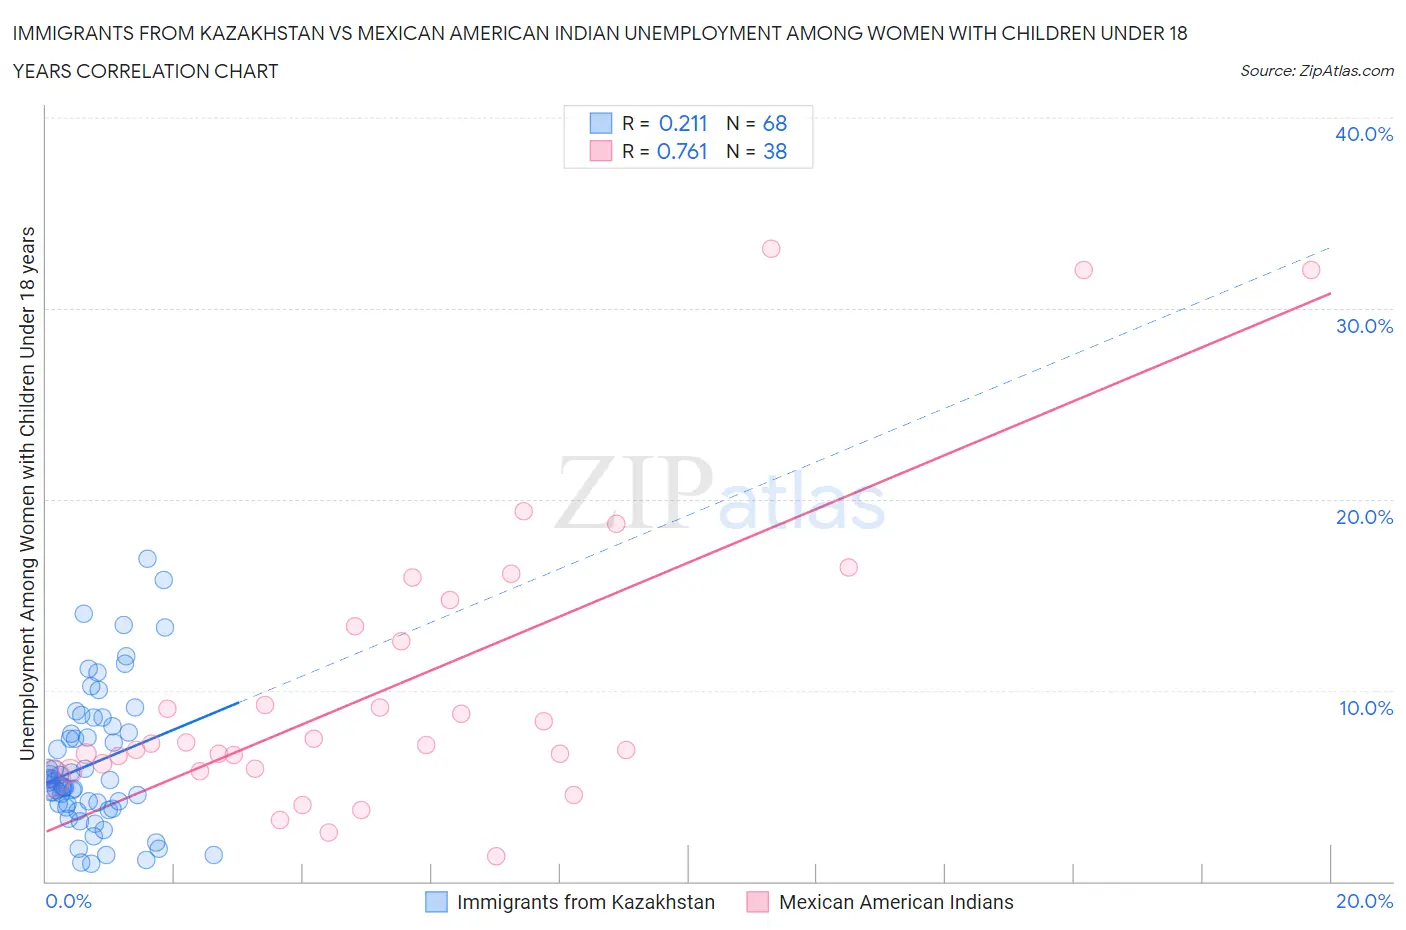
Immigrants from Kazakhstan vs Mexican American Indian Unemployment Among Women with Children Under 18 years Correlation Chart
The statistical analysis conducted on geographies consisting of 122,704,212 people shows a weak positive correlation between the proportion of Immigrants from Kazakhstan and unemployment rate among women with children under the age of 18 in the United States with a correlation coefficient (R) of 0.211 and weighted average of 5.4%. Similarly, the statistical analysis conducted on geographies consisting of 310,243,833 people shows a strong positive correlation between the proportion of Mexican American Indians and unemployment rate among women with children under the age of 18 in the United States with a correlation coefficient (R) of 0.761 and weighted average of 6.2%, a difference of 14.6%.
Unemployment Among Women with Children Under 18 years Correlation Summary
| Measurement | Immigrants from Kazakhstan | Mexican American Indian |
| Minimum | 0.92% | 1.3% |
| Maximum | 16.9% | 33.1% |
| Range | 16.0% | 31.8% |
| Mean | 6.1% | 10.3% |
| Median | 5.2% | 7.2% |
| Interquartile 25% (IQ1) | 4.0% | 5.9% |
| Interquartile 75% (IQ3) | 8.0% | 13.4% |
| Interquartile Range (IQR) | 4.0% | 7.5% |
| Standard Deviation (Sample) | 3.6% | 7.9% |
| Standard Deviation (Population) | 3.6% | 7.8% |
Similar Demographics by Unemployment Among Women with Children Under 18 years
Demographics Similar to Immigrants from Kazakhstan by Unemployment Among Women with Children Under 18 years
In terms of unemployment among women with children under 18 years, the demographic groups most similar to Immigrants from Kazakhstan are Immigrants from Eastern Africa (5.4%, a difference of 0.030%), Immigrants from Philippines (5.4%, a difference of 0.10%), Immigrants from Uzbekistan (5.4%, a difference of 0.12%), Samoan (5.4%, a difference of 0.17%), and Spanish (5.4%, a difference of 0.19%).
| Demographics | Rating | Rank | Unemployment Among Women with Children Under 18 years |
| Tlingit-Haida | 61.9 /100 | #165 | Good 5.4% |
| Aleuts | 59.4 /100 | #166 | Average 5.4% |
| Immigrants | Denmark | 58.0 /100 | #167 | Average 5.4% |
| Immigrants | Northern Africa | 56.1 /100 | #168 | Average 5.4% |
| Immigrants | Thailand | 55.3 /100 | #169 | Average 5.4% |
| Samoans | 54.1 /100 | #170 | Average 5.4% |
| Immigrants | Philippines | 53.1 /100 | #171 | Average 5.4% |
| Immigrants | Kazakhstan | 51.7 /100 | #172 | Average 5.4% |
| Immigrants | Eastern Africa | 51.3 /100 | #173 | Average 5.4% |
| Immigrants | Uzbekistan | 50.0 /100 | #174 | Average 5.4% |
| Spanish | 49.0 /100 | #175 | Average 5.4% |
| Immigrants | Germany | 48.5 /100 | #176 | Average 5.5% |
| Hawaiians | 46.1 /100 | #177 | Average 5.5% |
| Costa Ricans | 45.2 /100 | #178 | Average 5.5% |
| Syrians | 42.8 /100 | #179 | Average 5.5% |
Demographics Similar to Mexican American Indians by Unemployment Among Women with Children Under 18 years
In terms of unemployment among women with children under 18 years, the demographic groups most similar to Mexican American Indians are Immigrants from Ghana (6.2%, a difference of 0.010%), Immigrants from Barbados (6.2%, a difference of 0.010%), Dutch West Indian (6.2%, a difference of 0.12%), Senegalese (6.2%, a difference of 0.30%), and Immigrants from Western Africa (6.2%, a difference of 0.32%).
| Demographics | Rating | Rank | Unemployment Among Women with Children Under 18 years |
| Ghanaians | 0.1 /100 | #270 | Tragic 6.2% |
| Central Americans | 0.0 /100 | #271 | Tragic 6.2% |
| Salvadorans | 0.0 /100 | #272 | Tragic 6.2% |
| Immigrants | Western Africa | 0.0 /100 | #273 | Tragic 6.2% |
| Senegalese | 0.0 /100 | #274 | Tragic 6.2% |
| Dutch West Indians | 0.0 /100 | #275 | Tragic 6.2% |
| Immigrants | Ghana | 0.0 /100 | #276 | Tragic 6.2% |
| Mexican American Indians | 0.0 /100 | #277 | Tragic 6.2% |
| Immigrants | Barbados | 0.0 /100 | #278 | Tragic 6.2% |
| Immigrants | Portugal | 0.0 /100 | #279 | Tragic 6.3% |
| Guatemalans | 0.0 /100 | #280 | Tragic 6.3% |
| Immigrants | El Salvador | 0.0 /100 | #281 | Tragic 6.3% |
| Immigrants | St. Vincent and the Grenadines | 0.0 /100 | #282 | Tragic 6.3% |
| West Indians | 0.0 /100 | #283 | Tragic 6.3% |
| Immigrants | Grenada | 0.0 /100 | #284 | Tragic 6.3% |