Immigrants from Kazakhstan vs Immigrants from Trinidad and Tobago Unemployment Among Ages 16 to 19 years
COMPARE
Immigrants from Kazakhstan
Immigrants from Trinidad and Tobago
Unemployment Among Ages 16 to 19 years
Unemployment Among Ages 16 to 19 years Comparison
Immigrants from Kazakhstan
Immigrants from Trinidad and Tobago
18.0%
UNEMPLOYMENT AMONG AGES 16 TO 19 YEARS
13.0/ 100
METRIC RATING
216th/ 347
METRIC RANK
23.1%
UNEMPLOYMENT AMONG AGES 16 TO 19 YEARS
0.0/ 100
METRIC RATING
326th/ 347
METRIC RANK
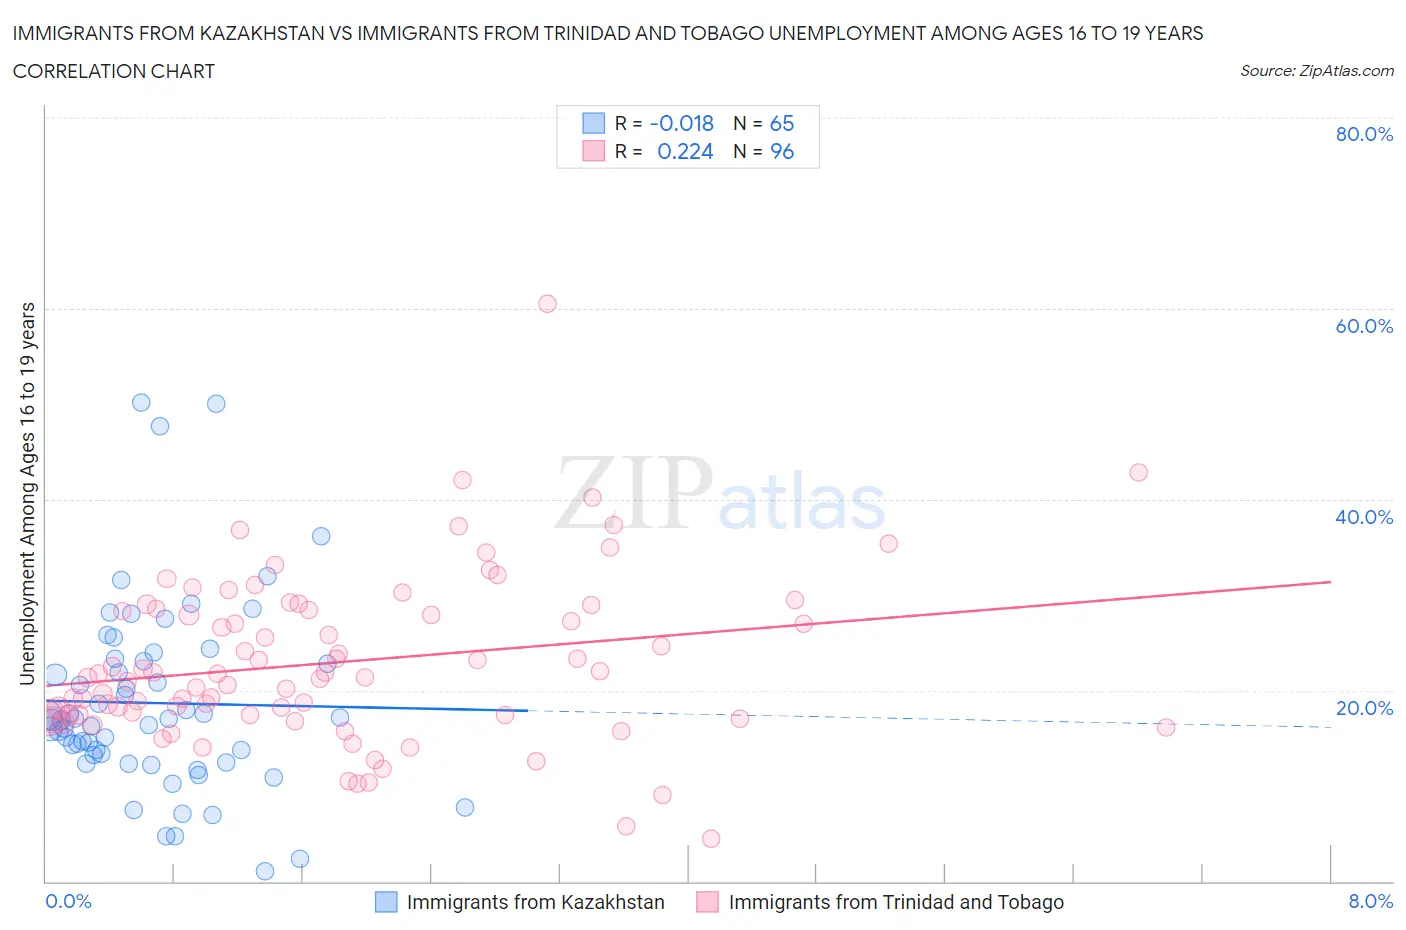
Immigrants from Kazakhstan vs Immigrants from Trinidad and Tobago Unemployment Among Ages 16 to 19 years Correlation Chart
The statistical analysis conducted on geographies consisting of 121,724,453 people shows no correlation between the proportion of Immigrants from Kazakhstan and unemployment rate among population between the ages 16 and 19 in the United States with a correlation coefficient (R) of -0.018 and weighted average of 18.0%. Similarly, the statistical analysis conducted on geographies consisting of 216,632,752 people shows a weak positive correlation between the proportion of Immigrants from Trinidad and Tobago and unemployment rate among population between the ages 16 and 19 in the United States with a correlation coefficient (R) of 0.224 and weighted average of 23.1%, a difference of 28.5%.
Unemployment Among Ages 16 to 19 years Correlation Summary
| Measurement | Immigrants from Kazakhstan | Immigrants from Trinidad and Tobago |
| Minimum | 1.1% | 4.5% |
| Maximum | 50.1% | 60.5% |
| Range | 49.0% | 56.0% |
| Mean | 18.7% | 23.0% |
| Median | 16.9% | 21.5% |
| Interquartile 25% (IQ1) | 12.9% | 17.4% |
| Interquartile 75% (IQ3) | 23.2% | 28.5% |
| Interquartile Range (IQR) | 10.4% | 11.1% |
| Standard Deviation (Sample) | 9.9% | 8.8% |
| Standard Deviation (Population) | 9.8% | 8.7% |
Similar Demographics by Unemployment Among Ages 16 to 19 years
Demographics Similar to Immigrants from Kazakhstan by Unemployment Among Ages 16 to 19 years
In terms of unemployment among ages 16 to 19 years, the demographic groups most similar to Immigrants from Kazakhstan are South American Indian (18.0%, a difference of 0.0%), Immigrants from Syria (18.0%, a difference of 0.030%), Immigrants from Argentina (18.0%, a difference of 0.050%), Immigrants from Morocco (18.0%, a difference of 0.060%), and Chippewa (18.0%, a difference of 0.080%).
| Demographics | Rating | Rank | Unemployment Among Ages 16 to 19 years |
| Cherokee | 15.7 /100 | #209 | Poor 17.9% |
| Carpatho Rusyns | 15.6 /100 | #210 | Poor 17.9% |
| Guamanians/Chamorros | 14.5 /100 | #211 | Poor 17.9% |
| Argentineans | 13.8 /100 | #212 | Poor 18.0% |
| Chippewa | 13.7 /100 | #213 | Poor 18.0% |
| Immigrants | Morocco | 13.5 /100 | #214 | Poor 18.0% |
| Immigrants | Syria | 13.3 /100 | #215 | Poor 18.0% |
| Immigrants | Kazakhstan | 13.0 /100 | #216 | Poor 18.0% |
| South American Indians | 13.0 /100 | #217 | Poor 18.0% |
| Immigrants | Argentina | 12.5 /100 | #218 | Poor 18.0% |
| Immigrants | Africa | 12.0 /100 | #219 | Poor 18.0% |
| Immigrants | Albania | 11.4 /100 | #220 | Poor 18.0% |
| Immigrants | Spain | 11.4 /100 | #221 | Poor 18.0% |
| Immigrants | Iran | 10.7 /100 | #222 | Poor 18.0% |
| Immigrants | Western Asia | 10.2 /100 | #223 | Poor 18.0% |
Demographics Similar to Immigrants from Trinidad and Tobago by Unemployment Among Ages 16 to 19 years
In terms of unemployment among ages 16 to 19 years, the demographic groups most similar to Immigrants from Trinidad and Tobago are Pima (23.1%, a difference of 0.26%), Immigrants from Dominican Republic (23.3%, a difference of 0.93%), Trinidadian and Tobagonian (22.6%, a difference of 2.0%), Tlingit-Haida (23.5%, a difference of 2.0%), and Immigrants from Armenia (22.6%, a difference of 2.1%).
| Demographics | Rating | Rank | Unemployment Among Ages 16 to 19 years |
| Immigrants | West Indies | 0.0 /100 | #319 | Tragic 22.2% |
| Cheyenne | 0.0 /100 | #320 | Tragic 22.3% |
| West Indians | 0.0 /100 | #321 | Tragic 22.4% |
| Barbadians | 0.0 /100 | #322 | Tragic 22.5% |
| Yakama | 0.0 /100 | #323 | Tragic 22.5% |
| Immigrants | Armenia | 0.0 /100 | #324 | Tragic 22.6% |
| Trinidadians and Tobagonians | 0.0 /100 | #325 | Tragic 22.6% |
| Immigrants | Trinidad and Tobago | 0.0 /100 | #326 | Tragic 23.1% |
| Pima | 0.0 /100 | #327 | Tragic 23.1% |
| Immigrants | Dominican Republic | 0.0 /100 | #328 | Tragic 23.3% |
| Tlingit-Haida | 0.0 /100 | #329 | Tragic 23.5% |
| Dominicans | 0.0 /100 | #330 | Tragic 23.6% |
| British West Indians | 0.0 /100 | #331 | Tragic 24.0% |
| Immigrants | Barbados | 0.0 /100 | #332 | Tragic 24.0% |
| Paiute | 0.0 /100 | #333 | Tragic 24.4% |