Immigrants from Japan vs Sioux Unemployment
COMPARE
Immigrants from Japan
Sioux
Unemployment
Unemployment Comparison
Immigrants from Japan
Sioux
4.9%
UNEMPLOYMENT
98.3/ 100
METRIC RATING
71st/ 347
METRIC RANK
7.4%
UNEMPLOYMENT
0.0/ 100
METRIC RATING
332nd/ 347
METRIC RANK
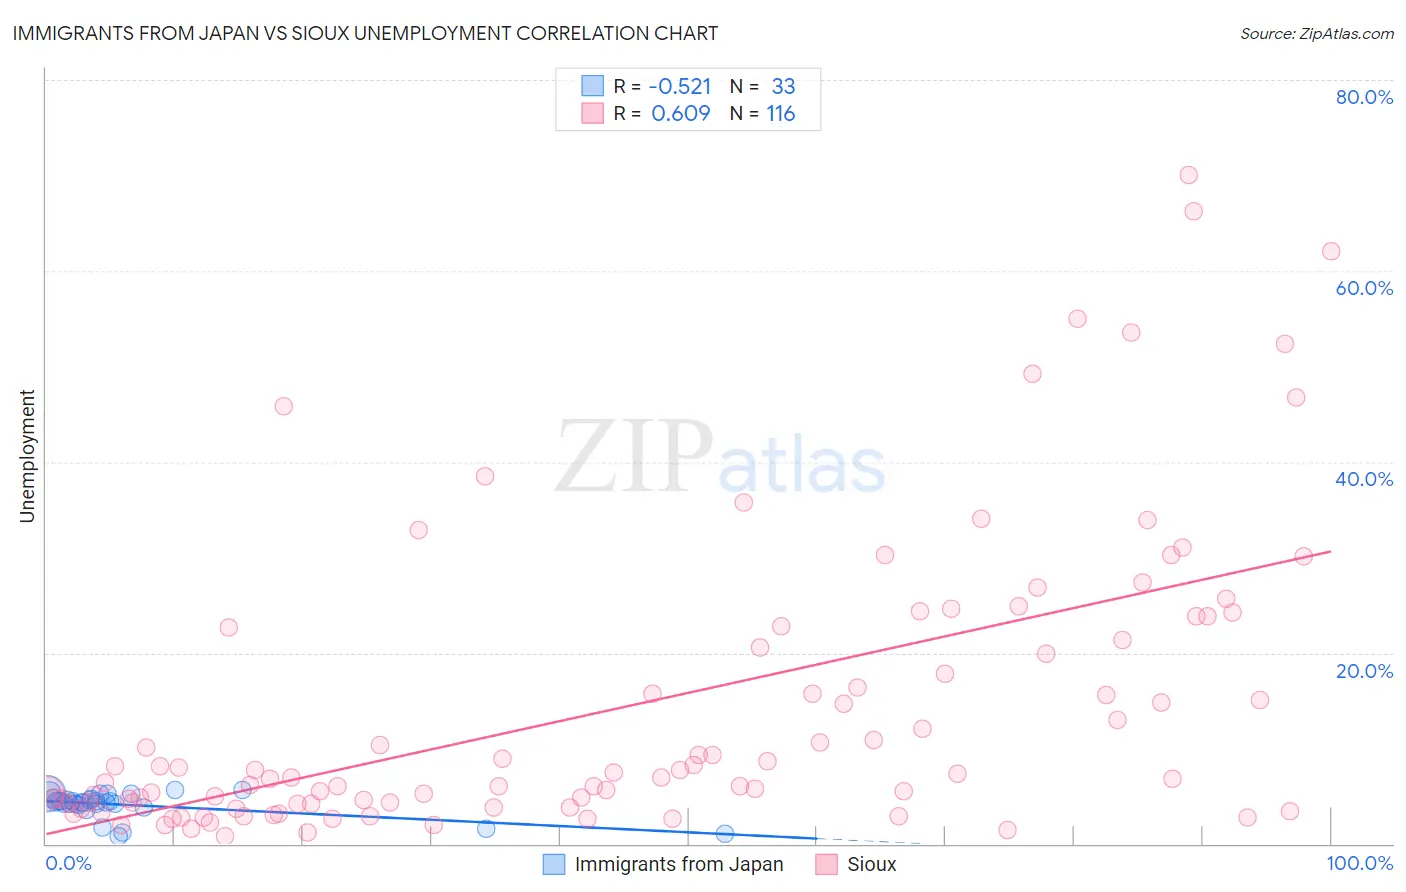
Immigrants from Japan vs Sioux Unemployment Correlation Chart
The statistical analysis conducted on geographies consisting of 339,966,426 people shows a substantial negative correlation between the proportion of Immigrants from Japan and unemployment in the United States with a correlation coefficient (R) of -0.521 and weighted average of 4.9%. Similarly, the statistical analysis conducted on geographies consisting of 233,819,220 people shows a significant positive correlation between the proportion of Sioux and unemployment in the United States with a correlation coefficient (R) of 0.609 and weighted average of 7.4%, a difference of 49.9%.
Unemployment Correlation Summary
| Measurement | Immigrants from Japan | Sioux |
| Minimum | 0.80% | 0.80% |
| Maximum | 5.6% | 70.0% |
| Range | 4.8% | 69.2% |
| Mean | 4.1% | 14.3% |
| Median | 4.4% | 7.1% |
| Interquartile 25% (IQ1) | 4.1% | 4.2% |
| Interquartile 75% (IQ3) | 4.7% | 22.0% |
| Interquartile Range (IQR) | 0.58% | 17.8% |
| Standard Deviation (Sample) | 1.3% | 15.4% |
| Standard Deviation (Population) | 1.3% | 15.3% |
Similar Demographics by Unemployment
Demographics Similar to Immigrants from Japan by Unemployment
In terms of unemployment, the demographic groups most similar to Immigrants from Japan are Burmese (4.9%, a difference of 0.020%), Serbian (4.9%, a difference of 0.050%), Paraguayan (4.9%, a difference of 0.070%), Immigrants from Northern Europe (4.9%, a difference of 0.16%), and Immigrants from North America (4.9%, a difference of 0.21%).
| Demographics | Rating | Rank | Unemployment |
| Italians | 98.9 /100 | #64 | Exceptional 4.9% |
| Immigrants | Canada | 98.8 /100 | #65 | Exceptional 4.9% |
| Slovaks | 98.7 /100 | #66 | Exceptional 4.9% |
| New Zealanders | 98.6 /100 | #67 | Exceptional 4.9% |
| Slavs | 98.6 /100 | #68 | Exceptional 4.9% |
| Immigrants | North America | 98.5 /100 | #69 | Exceptional 4.9% |
| Serbians | 98.4 /100 | #70 | Exceptional 4.9% |
| Immigrants | Japan | 98.3 /100 | #71 | Exceptional 4.9% |
| Burmese | 98.3 /100 | #72 | Exceptional 4.9% |
| Paraguayans | 98.3 /100 | #73 | Exceptional 4.9% |
| Immigrants | Northern Europe | 98.2 /100 | #74 | Exceptional 4.9% |
| Turks | 98.0 /100 | #75 | Exceptional 4.9% |
| German Russians | 98.0 /100 | #76 | Exceptional 4.9% |
| Cypriots | 97.9 /100 | #77 | Exceptional 4.9% |
| Okinawans | 97.9 /100 | #78 | Exceptional 4.9% |
Demographics Similar to Sioux by Unemployment
In terms of unemployment, the demographic groups most similar to Sioux are Immigrants from Dominican Republic (7.4%, a difference of 0.060%), Dominican (7.4%, a difference of 0.42%), Apache (7.4%, a difference of 0.53%), Yakama (7.3%, a difference of 0.76%), and Alaska Native (7.2%, a difference of 2.1%).
| Demographics | Rating | Rank | Unemployment |
| Natives/Alaskans | 0.0 /100 | #325 | Tragic 7.0% |
| Paiute | 0.0 /100 | #326 | Tragic 7.1% |
| Pueblo | 0.0 /100 | #327 | Tragic 7.2% |
| Tsimshian | 0.0 /100 | #328 | Tragic 7.2% |
| Alaska Natives | 0.0 /100 | #329 | Tragic 7.2% |
| Yakama | 0.0 /100 | #330 | Tragic 7.3% |
| Dominicans | 0.0 /100 | #331 | Tragic 7.4% |
| Sioux | 0.0 /100 | #332 | Tragic 7.4% |
| Immigrants | Dominican Republic | 0.0 /100 | #333 | Tragic 7.4% |
| Apache | 0.0 /100 | #334 | Tragic 7.4% |
| Alaskan Athabascans | 0.0 /100 | #335 | Tragic 7.7% |
| Immigrants | Yemen | 0.0 /100 | #336 | Tragic 7.7% |
| Cheyenne | 0.0 /100 | #337 | Tragic 8.0% |
| Pima | 0.0 /100 | #338 | Tragic 8.2% |
| Navajo | 0.0 /100 | #339 | Tragic 8.4% |