Immigrants from Bangladesh vs Sioux Unemployment
COMPARE
Immigrants from Bangladesh
Sioux
Unemployment
Unemployment Comparison
Immigrants from Bangladesh
Sioux
6.5%
UNEMPLOYMENT
0.0/ 100
METRIC RATING
307th/ 347
METRIC RANK
7.4%
UNEMPLOYMENT
0.0/ 100
METRIC RATING
332nd/ 347
METRIC RANK
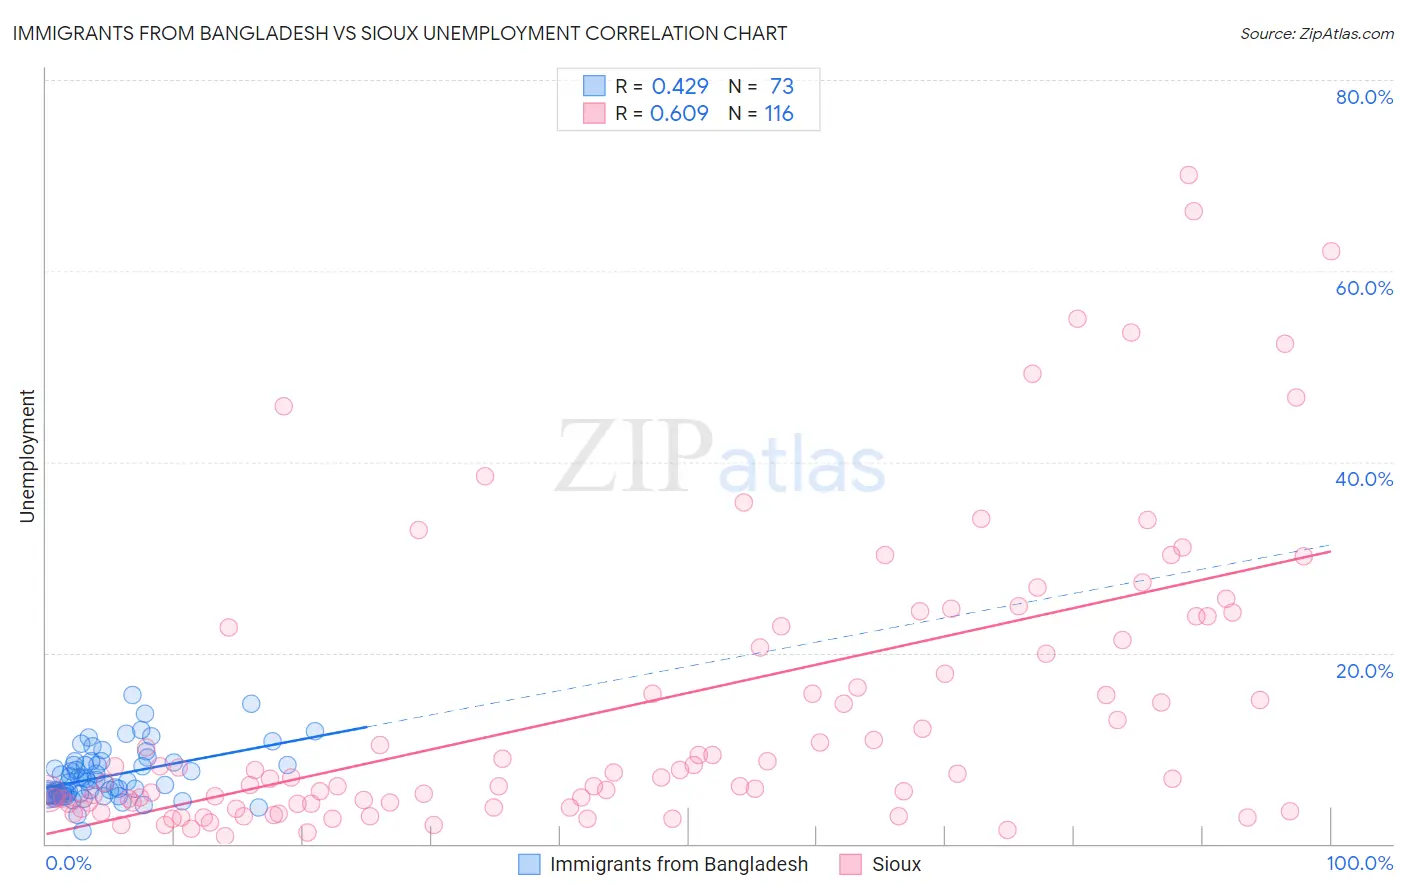
Immigrants from Bangladesh vs Sioux Unemployment Correlation Chart
The statistical analysis conducted on geographies consisting of 203,636,298 people shows a moderate positive correlation between the proportion of Immigrants from Bangladesh and unemployment in the United States with a correlation coefficient (R) of 0.429 and weighted average of 6.5%. Similarly, the statistical analysis conducted on geographies consisting of 233,819,220 people shows a significant positive correlation between the proportion of Sioux and unemployment in the United States with a correlation coefficient (R) of 0.609 and weighted average of 7.4%, a difference of 14.2%.
Unemployment Correlation Summary
| Measurement | Immigrants from Bangladesh | Sioux |
| Minimum | 1.3% | 0.80% |
| Maximum | 15.6% | 70.0% |
| Range | 14.3% | 69.2% |
| Mean | 7.1% | 14.3% |
| Median | 6.5% | 7.1% |
| Interquartile 25% (IQ1) | 5.2% | 4.2% |
| Interquartile 75% (IQ3) | 8.4% | 22.0% |
| Interquartile Range (IQR) | 3.2% | 17.8% |
| Standard Deviation (Sample) | 2.7% | 15.4% |
| Standard Deviation (Population) | 2.7% | 15.3% |
Similar Demographics by Unemployment
Demographics Similar to Immigrants from Bangladesh by Unemployment
In terms of unemployment, the demographic groups most similar to Immigrants from Bangladesh are Barbadian (6.5%, a difference of 0.37%), Vietnamese (6.5%, a difference of 0.38%), Lumbee (6.4%, a difference of 0.48%), Menominee (6.4%, a difference of 0.52%), and Immigrants from Belize (6.5%, a difference of 0.65%).
| Demographics | Rating | Rank | Unemployment |
| Immigrants | Trinidad and Tobago | 0.0 /100 | #300 | Tragic 6.3% |
| Trinidadians and Tobagonians | 0.0 /100 | #301 | Tragic 6.3% |
| West Indians | 0.0 /100 | #302 | Tragic 6.4% |
| Belizeans | 0.0 /100 | #303 | Tragic 6.4% |
| Immigrants | Jamaica | 0.0 /100 | #304 | Tragic 6.4% |
| Menominee | 0.0 /100 | #305 | Tragic 6.4% |
| Lumbee | 0.0 /100 | #306 | Tragic 6.4% |
| Immigrants | Bangladesh | 0.0 /100 | #307 | Tragic 6.5% |
| Barbadians | 0.0 /100 | #308 | Tragic 6.5% |
| Vietnamese | 0.0 /100 | #309 | Tragic 6.5% |
| Immigrants | Belize | 0.0 /100 | #310 | Tragic 6.5% |
| Cape Verdeans | 0.0 /100 | #311 | Tragic 6.5% |
| Colville | 0.0 /100 | #312 | Tragic 6.6% |
| Immigrants | Barbados | 0.0 /100 | #313 | Tragic 6.6% |
| Blacks/African Americans | 0.0 /100 | #314 | Tragic 6.6% |
Demographics Similar to Sioux by Unemployment
In terms of unemployment, the demographic groups most similar to Sioux are Immigrants from Dominican Republic (7.4%, a difference of 0.060%), Dominican (7.4%, a difference of 0.42%), Apache (7.4%, a difference of 0.53%), Yakama (7.3%, a difference of 0.76%), and Alaska Native (7.2%, a difference of 2.1%).
| Demographics | Rating | Rank | Unemployment |
| Natives/Alaskans | 0.0 /100 | #325 | Tragic 7.0% |
| Paiute | 0.0 /100 | #326 | Tragic 7.1% |
| Pueblo | 0.0 /100 | #327 | Tragic 7.2% |
| Tsimshian | 0.0 /100 | #328 | Tragic 7.2% |
| Alaska Natives | 0.0 /100 | #329 | Tragic 7.2% |
| Yakama | 0.0 /100 | #330 | Tragic 7.3% |
| Dominicans | 0.0 /100 | #331 | Tragic 7.4% |
| Sioux | 0.0 /100 | #332 | Tragic 7.4% |
| Immigrants | Dominican Republic | 0.0 /100 | #333 | Tragic 7.4% |
| Apache | 0.0 /100 | #334 | Tragic 7.4% |
| Alaskan Athabascans | 0.0 /100 | #335 | Tragic 7.7% |
| Immigrants | Yemen | 0.0 /100 | #336 | Tragic 7.7% |
| Cheyenne | 0.0 /100 | #337 | Tragic 8.0% |
| Pima | 0.0 /100 | #338 | Tragic 8.2% |
| Navajo | 0.0 /100 | #339 | Tragic 8.4% |