Colombian vs Native/Alaskan Unemployment Among Ages 45 to 54 years
COMPARE
Colombian
Native/Alaskan
Unemployment Among Ages 45 to 54 years
Unemployment Among Ages 45 to 54 years Comparison
Colombians
Natives/Alaskans
4.5%
UNEMPLOYMENT AMONG AGES 45 TO 54 YEARS
53.3/ 100
METRIC RATING
172nd/ 347
METRIC RANK
6.1%
UNEMPLOYMENT AMONG AGES 45 TO 54 YEARS
0.0/ 100
METRIC RATING
324th/ 347
METRIC RANK
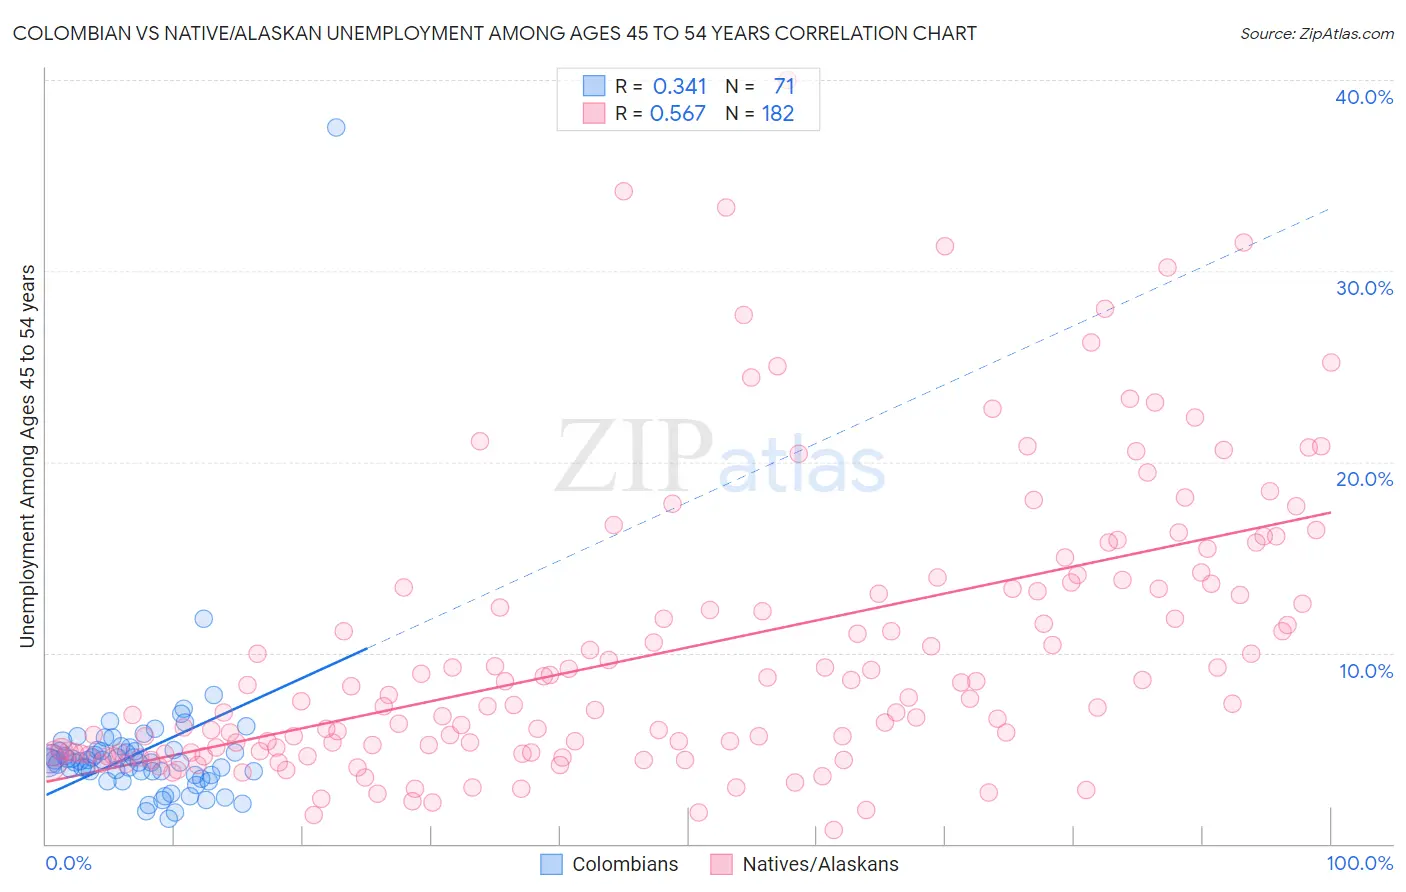
Colombian vs Native/Alaskan Unemployment Among Ages 45 to 54 years Correlation Chart
The statistical analysis conducted on geographies consisting of 408,904,428 people shows a mild positive correlation between the proportion of Colombians and unemployment rate among population between the ages 45 and 54 in the United States with a correlation coefficient (R) of 0.341 and weighted average of 4.5%. Similarly, the statistical analysis conducted on geographies consisting of 487,520,360 people shows a substantial positive correlation between the proportion of Natives/Alaskans and unemployment rate among population between the ages 45 and 54 in the United States with a correlation coefficient (R) of 0.567 and weighted average of 6.1%, a difference of 34.1%.
Unemployment Among Ages 45 to 54 years Correlation Summary
| Measurement | Colombian | Native/Alaskan |
| Minimum | 1.3% | 0.71% |
| Maximum | 37.5% | 40.0% |
| Range | 36.2% | 39.3% |
| Mean | 4.8% | 10.2% |
| Median | 4.3% | 7.4% |
| Interquartile 25% (IQ1) | 3.6% | 4.8% |
| Interquartile 75% (IQ3) | 4.9% | 13.4% |
| Interquartile Range (IQR) | 1.3% | 8.7% |
| Standard Deviation (Sample) | 4.2% | 7.5% |
| Standard Deviation (Population) | 4.2% | 7.4% |
Similar Demographics by Unemployment Among Ages 45 to 54 years
Demographics Similar to Colombians by Unemployment Among Ages 45 to 54 years
In terms of unemployment among ages 45 to 54 years, the demographic groups most similar to Colombians are Egyptian (4.5%, a difference of 0.010%), Spaniard (4.5%, a difference of 0.040%), Immigrants from Egypt (4.5%, a difference of 0.060%), Immigrants from Colombia (4.5%, a difference of 0.060%), and Immigrants from Europe (4.5%, a difference of 0.070%).
| Demographics | Rating | Rank | Unemployment Among Ages 45 to 54 years |
| Maltese | 57.9 /100 | #165 | Average 4.5% |
| Immigrants | Western Europe | 57.4 /100 | #166 | Average 4.5% |
| Immigrants | Brazil | 56.4 /100 | #167 | Average 4.5% |
| Immigrants | Europe | 54.7 /100 | #168 | Average 4.5% |
| Immigrants | Egypt | 54.7 /100 | #169 | Average 4.5% |
| Spaniards | 54.3 /100 | #170 | Average 4.5% |
| Egyptians | 53.6 /100 | #171 | Average 4.5% |
| Colombians | 53.3 /100 | #172 | Average 4.5% |
| Immigrants | Colombia | 52.0 /100 | #173 | Average 4.5% |
| Immigrants | Hungary | 50.0 /100 | #174 | Average 4.5% |
| Immigrants | France | 49.4 /100 | #175 | Average 4.5% |
| Puget Sound Salish | 49.1 /100 | #176 | Average 4.5% |
| Immigrants | Northern Africa | 49.0 /100 | #177 | Average 4.5% |
| Immigrants | Australia | 48.5 /100 | #178 | Average 4.5% |
| Immigrants | Russia | 48.2 /100 | #179 | Average 4.5% |
Demographics Similar to Natives/Alaskans by Unemployment Among Ages 45 to 54 years
In terms of unemployment among ages 45 to 54 years, the demographic groups most similar to Natives/Alaskans are Immigrants from Armenia (6.1%, a difference of 1.3%), Ute (6.2%, a difference of 2.2%), Immigrants from Cabo Verde (5.9%, a difference of 2.3%), Dominican (6.2%, a difference of 2.4%), and Pueblo (6.2%, a difference of 2.6%).
| Demographics | Rating | Rank | Unemployment Among Ages 45 to 54 years |
| Houma | 0.0 /100 | #317 | Tragic 5.6% |
| British West Indians | 0.0 /100 | #318 | Tragic 5.7% |
| Cape Verdeans | 0.0 /100 | #319 | Tragic 5.7% |
| Immigrants | St. Vincent and the Grenadines | 0.0 /100 | #320 | Tragic 5.7% |
| Yakama | 0.0 /100 | #321 | Tragic 5.7% |
| Immigrants | Azores | 0.0 /100 | #322 | Tragic 5.7% |
| Immigrants | Cabo Verde | 0.0 /100 | #323 | Tragic 5.9% |
| Natives/Alaskans | 0.0 /100 | #324 | Tragic 6.1% |
| Immigrants | Armenia | 0.0 /100 | #325 | Tragic 6.1% |
| Ute | 0.0 /100 | #326 | Tragic 6.2% |
| Dominicans | 0.0 /100 | #327 | Tragic 6.2% |
| Pueblo | 0.0 /100 | #328 | Tragic 6.2% |
| Alaska Natives | 0.0 /100 | #329 | Tragic 6.3% |
| Immigrants | Dominican Republic | 0.0 /100 | #330 | Tragic 6.3% |
| Tohono O'odham | 0.0 /100 | #331 | Tragic 6.3% |