Ugandan vs Salvadoran Unemployment Among Ages 16 to 19 years
COMPARE
Ugandan
Salvadoran
Unemployment Among Ages 16 to 19 years
Unemployment Among Ages 16 to 19 years Comparison
Ugandans
Salvadorans
16.8%
UNEMPLOYMENT AMONG AGES 16 TO 19 YEARS
97.4/ 100
METRIC RATING
83rd/ 347
METRIC RANK
18.9%
UNEMPLOYMENT AMONG AGES 16 TO 19 YEARS
0.1/ 100
METRIC RATING
262nd/ 347
METRIC RANK
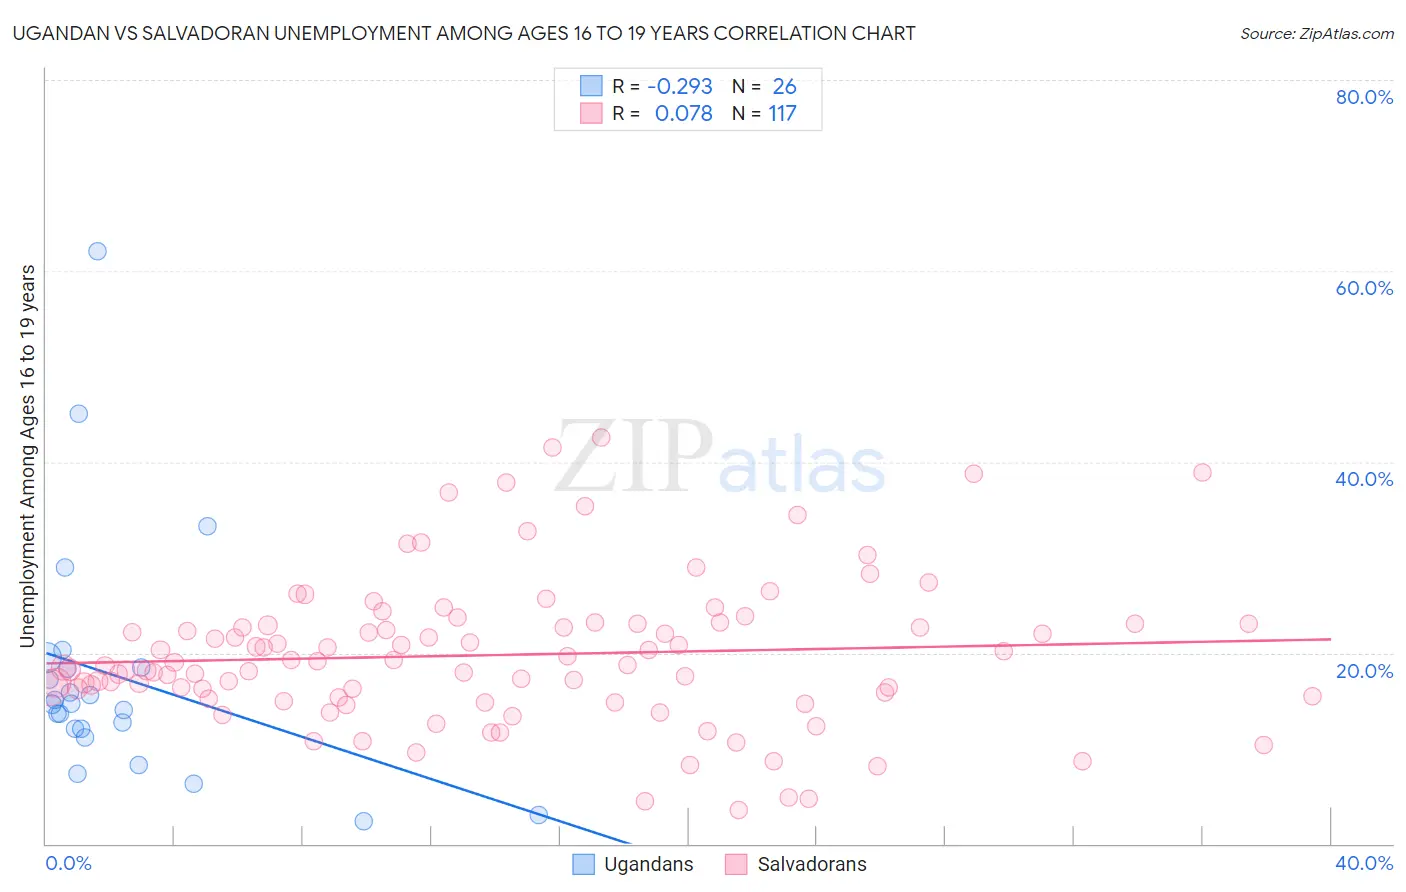
Ugandan vs Salvadoran Unemployment Among Ages 16 to 19 years Correlation Chart
The statistical analysis conducted on geographies consisting of 92,966,520 people shows a weak negative correlation between the proportion of Ugandans and unemployment rate among population between the ages 16 and 19 in the United States with a correlation coefficient (R) of -0.293 and weighted average of 16.8%. Similarly, the statistical analysis conducted on geographies consisting of 380,157,558 people shows a slight positive correlation between the proportion of Salvadorans and unemployment rate among population between the ages 16 and 19 in the United States with a correlation coefficient (R) of 0.078 and weighted average of 18.9%, a difference of 12.6%.
Unemployment Among Ages 16 to 19 years Correlation Summary
| Measurement | Ugandan | Salvadoran |
| Minimum | 2.4% | 3.6% |
| Maximum | 62.0% | 42.5% |
| Range | 59.6% | 38.9% |
| Mean | 17.5% | 19.8% |
| Median | 14.6% | 18.7% |
| Interquartile 25% (IQ1) | 12.0% | 15.4% |
| Interquartile 75% (IQ3) | 18.5% | 23.1% |
| Interquartile Range (IQR) | 6.5% | 7.7% |
| Standard Deviation (Sample) | 12.8% | 7.6% |
| Standard Deviation (Population) | 12.5% | 7.6% |
Similar Demographics by Unemployment Among Ages 16 to 19 years
Demographics Similar to Ugandans by Unemployment Among Ages 16 to 19 years
In terms of unemployment among ages 16 to 19 years, the demographic groups most similar to Ugandans are French Canadian (16.8%, a difference of 0.020%), Immigrants from Latvia (16.8%, a difference of 0.020%), White/Caucasian (16.8%, a difference of 0.020%), Slovak (16.8%, a difference of 0.030%), and French (16.8%, a difference of 0.040%).
| Demographics | Rating | Rank | Unemployment Among Ages 16 to 19 years |
| Immigrants | North America | 97.9 /100 | #76 | Exceptional 16.8% |
| Immigrants | Singapore | 97.8 /100 | #77 | Exceptional 16.8% |
| Soviet Union | 97.8 /100 | #78 | Exceptional 16.8% |
| Slovaks | 97.5 /100 | #79 | Exceptional 16.8% |
| French Canadians | 97.5 /100 | #80 | Exceptional 16.8% |
| Immigrants | Latvia | 97.5 /100 | #81 | Exceptional 16.8% |
| Whites/Caucasians | 97.5 /100 | #82 | Exceptional 16.8% |
| Ugandans | 97.4 /100 | #83 | Exceptional 16.8% |
| French | 97.4 /100 | #84 | Exceptional 16.8% |
| Immigrants | Kuwait | 97.2 /100 | #85 | Exceptional 16.8% |
| Immigrants | Scotland | 97.2 /100 | #86 | Exceptional 16.8% |
| Greeks | 97.0 /100 | #87 | Exceptional 16.9% |
| Immigrants | South Africa | 96.9 /100 | #88 | Exceptional 16.9% |
| Canadians | 96.7 /100 | #89 | Exceptional 16.9% |
| Asians | 96.6 /100 | #90 | Exceptional 16.9% |
Demographics Similar to Salvadorans by Unemployment Among Ages 16 to 19 years
In terms of unemployment among ages 16 to 19 years, the demographic groups most similar to Salvadorans are Spanish American Indian (18.9%, a difference of 0.040%), Nigerian (18.9%, a difference of 0.080%), Cree (19.0%, a difference of 0.13%), Immigrants from Central America (18.9%, a difference of 0.16%), and Yaqui (19.0%, a difference of 0.16%).
| Demographics | Rating | Rank | Unemployment Among Ages 16 to 19 years |
| Immigrants | Cameroon | 0.3 /100 | #255 | Tragic 18.8% |
| Mexican American Indians | 0.3 /100 | #256 | Tragic 18.8% |
| Immigrants | Nigeria | 0.2 /100 | #257 | Tragic 18.9% |
| Immigrants | Mexico | 0.2 /100 | #258 | Tragic 18.9% |
| Immigrants | Central America | 0.2 /100 | #259 | Tragic 18.9% |
| Nigerians | 0.2 /100 | #260 | Tragic 18.9% |
| Spanish American Indians | 0.1 /100 | #261 | Tragic 18.9% |
| Salvadorans | 0.1 /100 | #262 | Tragic 18.9% |
| Cree | 0.1 /100 | #263 | Tragic 19.0% |
| Yaqui | 0.1 /100 | #264 | Tragic 19.0% |
| Choctaw | 0.1 /100 | #265 | Tragic 19.0% |
| Immigrants | Honduras | 0.1 /100 | #266 | Tragic 19.0% |
| Israelis | 0.1 /100 | #267 | Tragic 19.0% |
| Immigrants | El Salvador | 0.1 /100 | #268 | Tragic 19.1% |
| Lumbee | 0.1 /100 | #269 | Tragic 19.1% |