Immigrants from Italy vs Immigrants from Mexico Unemployment Among Women with Children Under 6 years
COMPARE
Immigrants from Italy
Immigrants from Mexico
Unemployment Among Women with Children Under 6 years
Unemployment Among Women with Children Under 6 years Comparison
Immigrants from Italy
Immigrants from Mexico
7.2%
UNEMPLOYMENT AMONG WOMEN WITH CHILDREN UNDER 6 YEARS
96.1/ 100
METRIC RATING
115th/ 347
METRIC RANK
9.1%
UNEMPLOYMENT AMONG WOMEN WITH CHILDREN UNDER 6 YEARS
0.0/ 100
METRIC RATING
304th/ 347
METRIC RANK
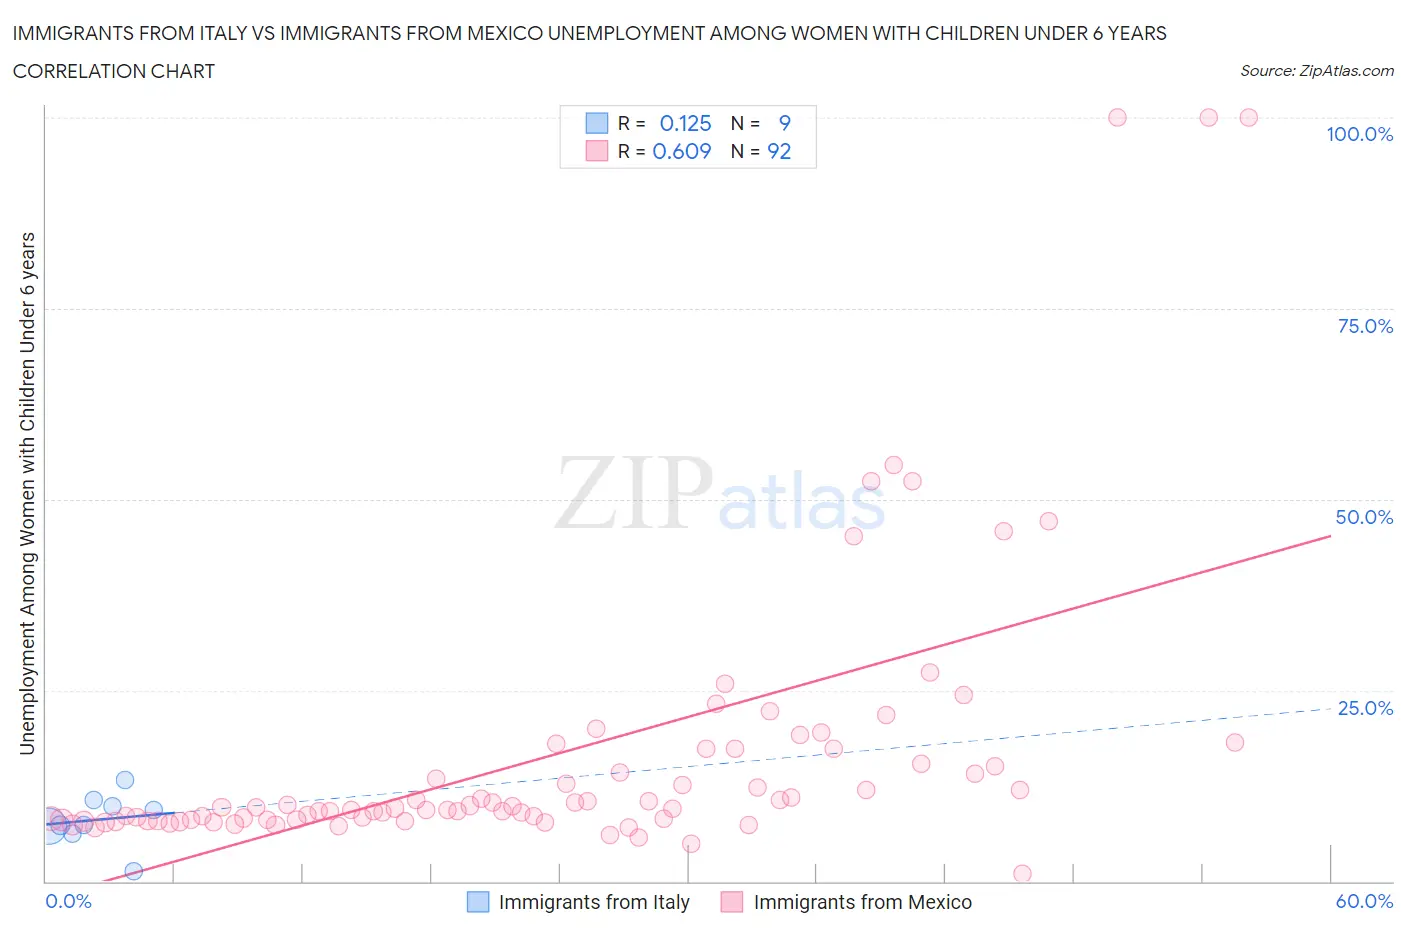
Immigrants from Italy vs Immigrants from Mexico Unemployment Among Women with Children Under 6 years Correlation Chart
The statistical analysis conducted on geographies consisting of 250,790,462 people shows a poor positive correlation between the proportion of Immigrants from Italy and unemployment rate among women with children under the age of 6 in the United States with a correlation coefficient (R) of 0.125 and weighted average of 7.2%. Similarly, the statistical analysis conducted on geographies consisting of 361,066,070 people shows a significant positive correlation between the proportion of Immigrants from Mexico and unemployment rate among women with children under the age of 6 in the United States with a correlation coefficient (R) of 0.609 and weighted average of 9.1%, a difference of 25.1%.
Unemployment Among Women with Children Under 6 years Correlation Summary
| Measurement | Immigrants from Italy | Immigrants from Mexico |
| Minimum | 1.3% | 1.0% |
| Maximum | 13.2% | 100.0% |
| Range | 11.9% | 99.0% |
| Mean | 8.1% | 16.5% |
| Median | 7.4% | 9.6% |
| Interquartile 25% (IQ1) | 6.7% | 8.0% |
| Interquartile 75% (IQ3) | 10.3% | 16.4% |
| Interquartile Range (IQR) | 3.6% | 8.4% |
| Standard Deviation (Sample) | 3.4% | 18.8% |
| Standard Deviation (Population) | 3.2% | 18.7% |
Similar Demographics by Unemployment Among Women with Children Under 6 years
Demographics Similar to Immigrants from Italy by Unemployment Among Women with Children Under 6 years
In terms of unemployment among women with children under 6 years, the demographic groups most similar to Immigrants from Italy are Argentinean (7.2%, a difference of 0.080%), Armenian (7.2%, a difference of 0.10%), Nicaraguan (7.2%, a difference of 0.12%), Israeli (7.2%, a difference of 0.20%), and Immigrants from Kenya (7.3%, a difference of 0.30%).
| Demographics | Rating | Rank | Unemployment Among Women with Children Under 6 years |
| Eastern Europeans | 96.9 /100 | #108 | Exceptional 7.2% |
| Australians | 96.9 /100 | #109 | Exceptional 7.2% |
| Palestinians | 96.8 /100 | #110 | Exceptional 7.2% |
| Norwegians | 96.7 /100 | #111 | Exceptional 7.2% |
| Israelis | 96.5 /100 | #112 | Exceptional 7.2% |
| Nicaraguans | 96.3 /100 | #113 | Exceptional 7.2% |
| Argentineans | 96.2 /100 | #114 | Exceptional 7.2% |
| Immigrants | Italy | 96.1 /100 | #115 | Exceptional 7.2% |
| Armenians | 95.9 /100 | #116 | Exceptional 7.2% |
| Immigrants | Kenya | 95.4 /100 | #117 | Exceptional 7.3% |
| Serbians | 94.5 /100 | #118 | Exceptional 7.3% |
| South Africans | 94.1 /100 | #119 | Exceptional 7.3% |
| Iraqis | 93.9 /100 | #120 | Exceptional 7.3% |
| Immigrants | Chile | 93.5 /100 | #121 | Exceptional 7.3% |
| Immigrants | Bosnia and Herzegovina | 93.5 /100 | #122 | Exceptional 7.3% |
Demographics Similar to Immigrants from Mexico by Unemployment Among Women with Children Under 6 years
In terms of unemployment among women with children under 6 years, the demographic groups most similar to Immigrants from Mexico are Immigrants from West Indies (9.0%, a difference of 0.14%), Hispanic or Latino (9.0%, a difference of 0.17%), Alaskan Athabascan (9.1%, a difference of 0.41%), Pueblo (9.1%, a difference of 0.58%), and Dominican (9.1%, a difference of 0.70%).
| Demographics | Rating | Rank | Unemployment Among Women with Children Under 6 years |
| Mexicans | 0.0 /100 | #297 | Tragic 8.9% |
| Tlingit-Haida | 0.0 /100 | #298 | Tragic 8.9% |
| Immigrants | Jamaica | 0.0 /100 | #299 | Tragic 8.9% |
| Creek | 0.0 /100 | #300 | Tragic 8.9% |
| Chickasaw | 0.0 /100 | #301 | Tragic 9.0% |
| Hispanics or Latinos | 0.0 /100 | #302 | Tragic 9.0% |
| Immigrants | West Indies | 0.0 /100 | #303 | Tragic 9.0% |
| Immigrants | Mexico | 0.0 /100 | #304 | Tragic 9.1% |
| Alaskan Athabascans | 0.0 /100 | #305 | Tragic 9.1% |
| Pueblo | 0.0 /100 | #306 | Tragic 9.1% |
| Dominicans | 0.0 /100 | #307 | Tragic 9.1% |
| Immigrants | Micronesia | 0.0 /100 | #308 | Tragic 9.1% |
| Africans | 0.0 /100 | #309 | Tragic 9.2% |
| Cajuns | 0.0 /100 | #310 | Tragic 9.2% |
| French American Indians | 0.0 /100 | #311 | Tragic 9.2% |