Immigrants from Israel vs Czech Unemployment Among Seniors over 65 years
COMPARE
Immigrants from Israel
Czech
Unemployment Among Seniors over 65 years
Unemployment Among Seniors over 65 years Comparison
Immigrants from Israel
Czechs
5.3%
UNEMPLOYMENT AMONG SENIORS OVER 65 YEARS
2.0/ 100
METRIC RATING
238th/ 347
METRIC RANK
4.7%
UNEMPLOYMENT AMONG SENIORS OVER 65 YEARS
100.0/ 100
METRIC RATING
22nd/ 347
METRIC RANK
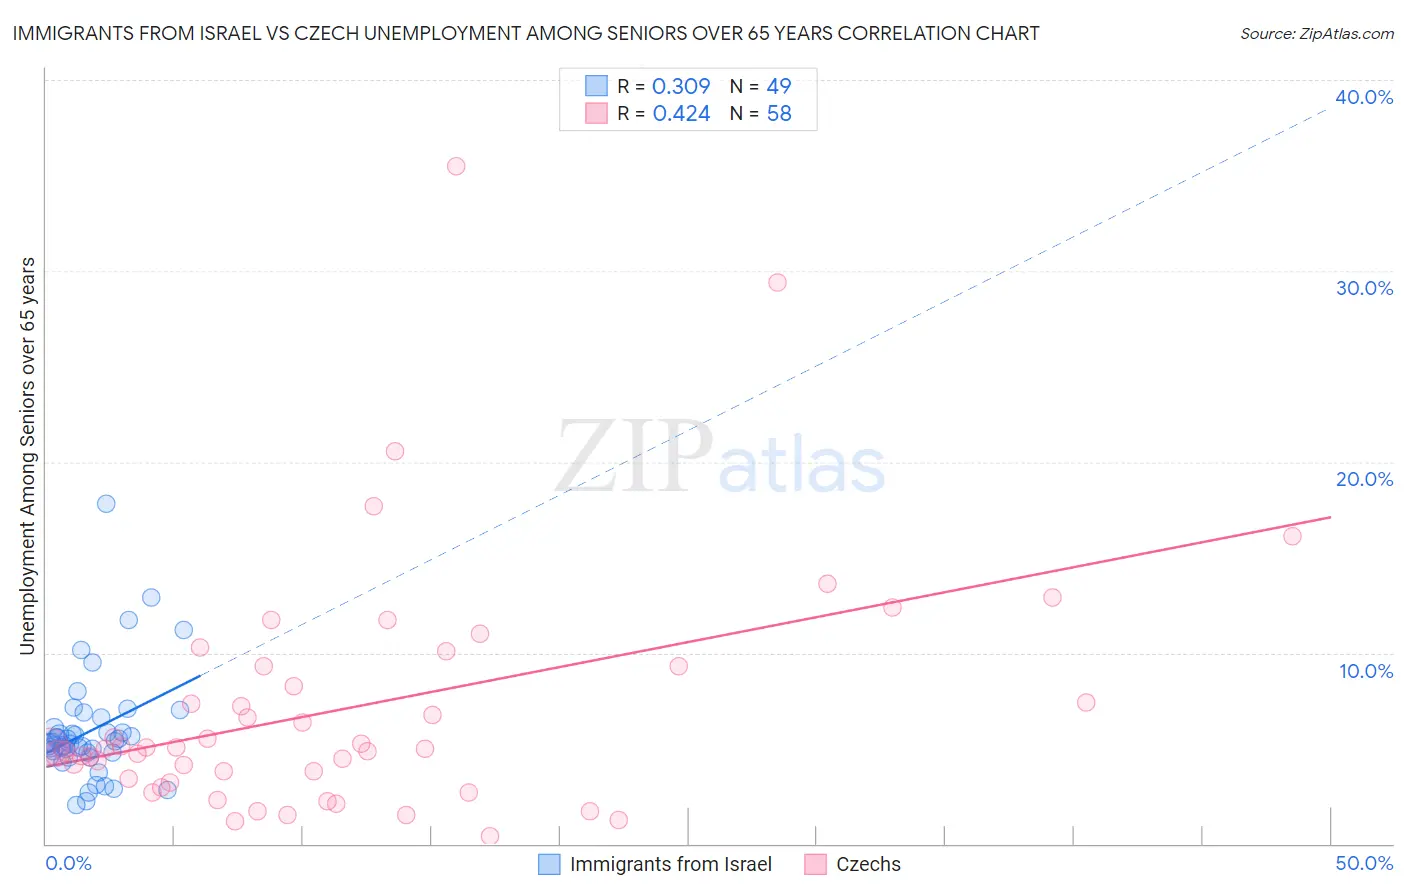
Immigrants from Israel vs Czech Unemployment Among Seniors over 65 years Correlation Chart
The statistical analysis conducted on geographies consisting of 201,020,149 people shows a mild positive correlation between the proportion of Immigrants from Israel and unemployment rate amomg seniors over the age of 65 in the United States with a correlation coefficient (R) of 0.309 and weighted average of 5.3%. Similarly, the statistical analysis conducted on geographies consisting of 413,421,008 people shows a moderate positive correlation between the proportion of Czechs and unemployment rate amomg seniors over the age of 65 in the United States with a correlation coefficient (R) of 0.424 and weighted average of 4.7%, a difference of 13.0%.
Unemployment Among Seniors over 65 years Correlation Summary
| Measurement | Immigrants from Israel | Czech |
| Minimum | 2.0% | 0.40% |
| Maximum | 17.8% | 35.5% |
| Range | 15.8% | 35.1% |
| Mean | 5.9% | 7.1% |
| Median | 5.3% | 5.0% |
| Interquartile 25% (IQ1) | 4.8% | 3.4% |
| Interquartile 75% (IQ3) | 6.3% | 9.3% |
| Interquartile Range (IQR) | 1.6% | 5.9% |
| Standard Deviation (Sample) | 2.9% | 6.5% |
| Standard Deviation (Population) | 2.8% | 6.4% |
Similar Demographics by Unemployment Among Seniors over 65 years
Demographics Similar to Immigrants from Israel by Unemployment Among Seniors over 65 years
In terms of unemployment among seniors over 65 years, the demographic groups most similar to Immigrants from Israel are Immigrants from Greece (5.3%, a difference of 0.010%), Immigrants from Senegal (5.3%, a difference of 0.060%), Immigrants from Costa Rica (5.3%, a difference of 0.070%), Immigrants from Trinidad and Tobago (5.3%, a difference of 0.17%), and Immigrants from Albania (5.3%, a difference of 0.26%).
| Demographics | Rating | Rank | Unemployment Among Seniors over 65 years |
| Hungarians | 3.9 /100 | #231 | Tragic 5.3% |
| Hopi | 3.5 /100 | #232 | Tragic 5.3% |
| Marshallese | 3.1 /100 | #233 | Tragic 5.3% |
| Blackfeet | 3.1 /100 | #234 | Tragic 5.3% |
| Immigrants | Albania | 2.7 /100 | #235 | Tragic 5.3% |
| Immigrants | Costa Rica | 2.1 /100 | #236 | Tragic 5.3% |
| Immigrants | Greece | 2.0 /100 | #237 | Tragic 5.3% |
| Immigrants | Israel | 2.0 /100 | #238 | Tragic 5.3% |
| Immigrants | Senegal | 1.8 /100 | #239 | Tragic 5.3% |
| Immigrants | Trinidad and Tobago | 1.6 /100 | #240 | Tragic 5.3% |
| Apache | 1.3 /100 | #241 | Tragic 5.3% |
| Bahamians | 0.9 /100 | #242 | Tragic 5.3% |
| Nigerians | 0.9 /100 | #243 | Tragic 5.3% |
| Peruvians | 0.8 /100 | #244 | Tragic 5.3% |
| Ottawa | 0.8 /100 | #245 | Tragic 5.3% |
Demographics Similar to Czechs by Unemployment Among Seniors over 65 years
In terms of unemployment among seniors over 65 years, the demographic groups most similar to Czechs are Norwegian (4.7%, a difference of 0.18%), Immigrants from Nepal (4.7%, a difference of 0.40%), Lebanese (4.7%, a difference of 0.41%), Kenyan (4.7%, a difference of 0.42%), and Iraqi (4.7%, a difference of 0.81%).
| Demographics | Rating | Rank | Unemployment Among Seniors over 65 years |
| Lumbee | 100.0 /100 | #15 | Exceptional 4.6% |
| Immigrants | Burma/Myanmar | 100.0 /100 | #16 | Exceptional 4.6% |
| Creek | 100.0 /100 | #17 | Exceptional 4.6% |
| Immigrants | Eritrea | 100.0 /100 | #18 | Exceptional 4.7% |
| Lebanese | 100.0 /100 | #19 | Exceptional 4.7% |
| Immigrants | Nepal | 100.0 /100 | #20 | Exceptional 4.7% |
| Norwegians | 100.0 /100 | #21 | Exceptional 4.7% |
| Czechs | 100.0 /100 | #22 | Exceptional 4.7% |
| Kenyans | 100.0 /100 | #23 | Exceptional 4.7% |
| Iraqis | 100.0 /100 | #24 | Exceptional 4.7% |
| Tongans | 100.0 /100 | #25 | Exceptional 4.7% |
| Immigrants | Lebanon | 100.0 /100 | #26 | Exceptional 4.8% |
| Houma | 100.0 /100 | #27 | Exceptional 4.8% |
| Ugandans | 100.0 /100 | #28 | Exceptional 4.8% |
| Immigrants | North Macedonia | 100.0 /100 | #29 | Exceptional 4.8% |