Immigrants from Indonesia vs Czech Unemployment Among Seniors over 65 years
COMPARE
Immigrants from Indonesia
Czech
Unemployment Among Seniors over 65 years
Unemployment Among Seniors over 65 years Comparison
Immigrants from Indonesia
Czechs
5.1%
UNEMPLOYMENT AMONG SENIORS OVER 65 YEARS
81.0/ 100
METRIC RATING
142nd/ 347
METRIC RANK
4.7%
UNEMPLOYMENT AMONG SENIORS OVER 65 YEARS
100.0/ 100
METRIC RATING
22nd/ 347
METRIC RANK
Immigrants from Indonesia vs Czech Unemployment Among Seniors over 65 years Correlation Chart
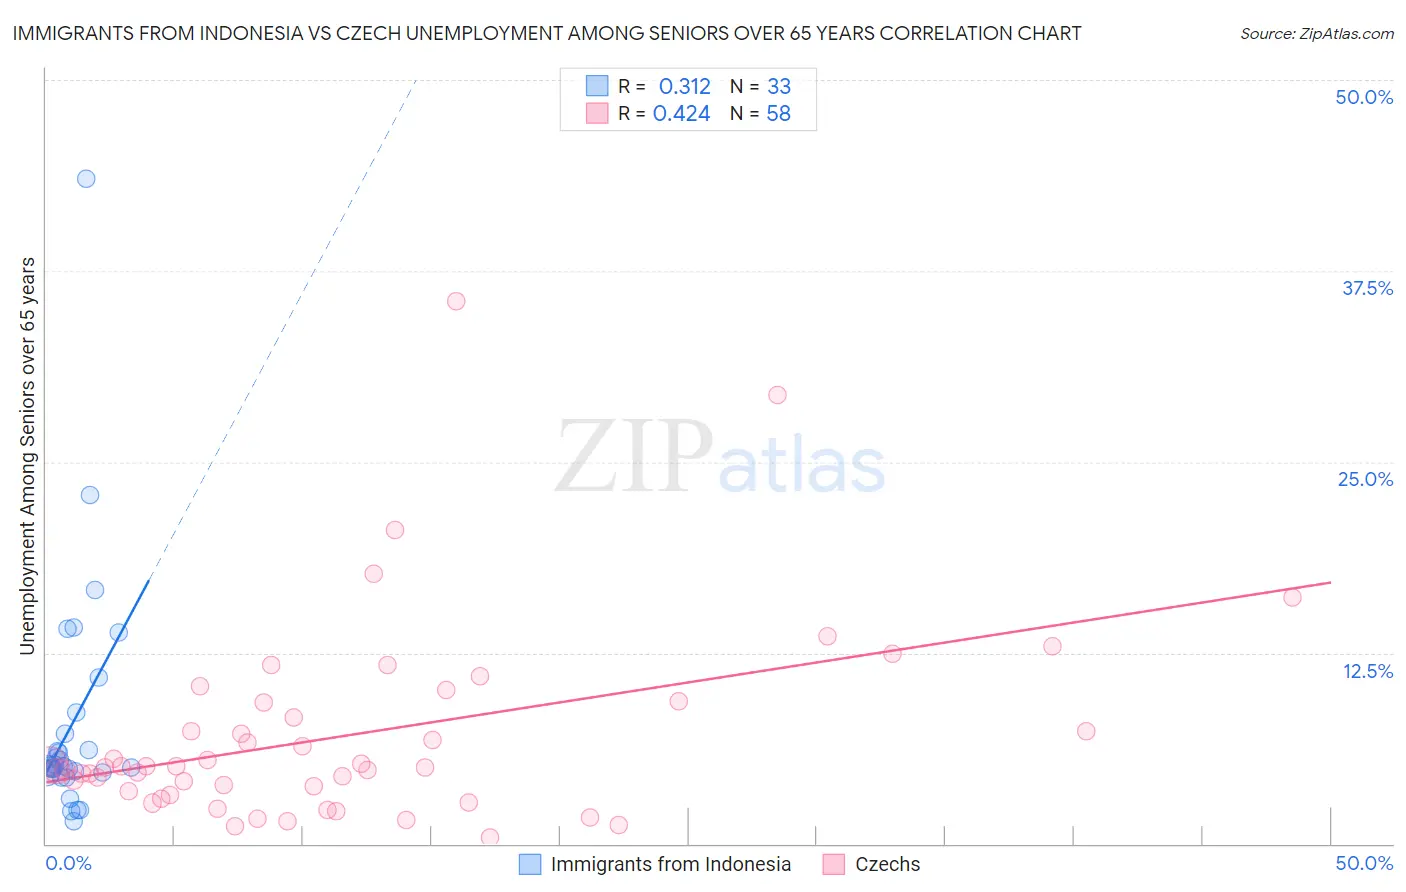
The statistical analysis conducted on geographies consisting of 205,748,414 people shows a mild positive correlation between the proportion of Immigrants from Indonesia and unemployment rate amomg seniors over the age of 65 in the United States with a correlation coefficient (R) of 0.312 and weighted average of 5.1%. Similarly, the statistical analysis conducted on geographies consisting of 413,421,008 people shows a moderate positive correlation between the proportion of Czechs and unemployment rate amomg seniors over the age of 65 in the United States with a correlation coefficient (R) of 0.424 and weighted average of 4.7%, a difference of 8.3%.
Unemployment Among Seniors over 65 years Correlation Summary
| Measurement | Immigrants from Indonesia | Czech |
| Minimum | 1.5% | 0.40% |
| Maximum | 43.5% | 35.5% |
| Range | 42.0% | 35.1% |
| Mean | 7.9% | 7.1% |
| Median | 5.1% | 5.0% |
| Interquartile 25% (IQ1) | 4.7% | 3.4% |
| Interquartile 75% (IQ3) | 7.9% | 9.3% |
| Interquartile Range (IQR) | 3.2% | 5.9% |
| Standard Deviation (Sample) | 7.9% | 6.5% |
| Standard Deviation (Population) | 7.8% | 6.4% |
Similar Demographics by Unemployment Among Seniors over 65 years
Demographics Similar to Immigrants from Indonesia by Unemployment Among Seniors over 65 years
In terms of unemployment among seniors over 65 years, the demographic groups most similar to Immigrants from Indonesia are Cherokee (5.1%, a difference of 0.030%), Senegalese (5.1%, a difference of 0.030%), Polish (5.1%, a difference of 0.040%), Immigrants from Panama (5.1%, a difference of 0.11%), and Immigrants from Chile (5.1%, a difference of 0.11%).
| Demographics | Rating | Rank | Unemployment Among Seniors over 65 years |
| Ukrainians | 84.4 /100 | #135 | Excellent 5.1% |
| Whites/Caucasians | 84.4 /100 | #136 | Excellent 5.1% |
| Arabs | 84.3 /100 | #137 | Excellent 5.1% |
| New Zealanders | 83.2 /100 | #138 | Excellent 5.1% |
| Immigrants | Panama | 83.0 /100 | #139 | Excellent 5.1% |
| Immigrants | Chile | 83.0 /100 | #140 | Excellent 5.1% |
| Cherokee | 81.6 /100 | #141 | Excellent 5.1% |
| Immigrants | Indonesia | 81.0 /100 | #142 | Excellent 5.1% |
| Senegalese | 80.4 /100 | #143 | Excellent 5.1% |
| Poles | 80.3 /100 | #144 | Excellent 5.1% |
| Spanish | 78.8 /100 | #145 | Good 5.1% |
| Immigrants | Russia | 78.5 /100 | #146 | Good 5.1% |
| Slovaks | 77.9 /100 | #147 | Good 5.1% |
| Greeks | 77.0 /100 | #148 | Good 5.1% |
| Immigrants | Afghanistan | 76.8 /100 | #149 | Good 5.1% |
Demographics Similar to Czechs by Unemployment Among Seniors over 65 years
In terms of unemployment among seniors over 65 years, the demographic groups most similar to Czechs are Norwegian (4.7%, a difference of 0.18%), Immigrants from Nepal (4.7%, a difference of 0.40%), Lebanese (4.7%, a difference of 0.41%), Kenyan (4.7%, a difference of 0.42%), and Iraqi (4.7%, a difference of 0.81%).
| Demographics | Rating | Rank | Unemployment Among Seniors over 65 years |
| Lumbee | 100.0 /100 | #15 | Exceptional 4.6% |
| Immigrants | Burma/Myanmar | 100.0 /100 | #16 | Exceptional 4.6% |
| Creek | 100.0 /100 | #17 | Exceptional 4.6% |
| Immigrants | Eritrea | 100.0 /100 | #18 | Exceptional 4.7% |
| Lebanese | 100.0 /100 | #19 | Exceptional 4.7% |
| Immigrants | Nepal | 100.0 /100 | #20 | Exceptional 4.7% |
| Norwegians | 100.0 /100 | #21 | Exceptional 4.7% |
| Czechs | 100.0 /100 | #22 | Exceptional 4.7% |
| Kenyans | 100.0 /100 | #23 | Exceptional 4.7% |
| Iraqis | 100.0 /100 | #24 | Exceptional 4.7% |
| Tongans | 100.0 /100 | #25 | Exceptional 4.7% |
| Immigrants | Lebanon | 100.0 /100 | #26 | Exceptional 4.8% |
| Houma | 100.0 /100 | #27 | Exceptional 4.8% |
| Ugandans | 100.0 /100 | #28 | Exceptional 4.8% |
| Immigrants | North Macedonia | 100.0 /100 | #29 | Exceptional 4.8% |