Immigrants from Ireland vs Immigrants from Zaire Unemployment Among Women with Children Under 6 years
COMPARE
Immigrants from Ireland
Immigrants from Zaire
Unemployment Among Women with Children Under 6 years
Unemployment Among Women with Children Under 6 years Comparison
Immigrants from Ireland
Immigrants from Zaire
6.8%
UNEMPLOYMENT AMONG WOMEN WITH CHILDREN UNDER 6 YEARS
99.9/ 100
METRIC RATING
50th/ 347
METRIC RANK
7.3%
UNEMPLOYMENT AMONG WOMEN WITH CHILDREN UNDER 6 YEARS
93.3/ 100
METRIC RATING
123rd/ 347
METRIC RANK
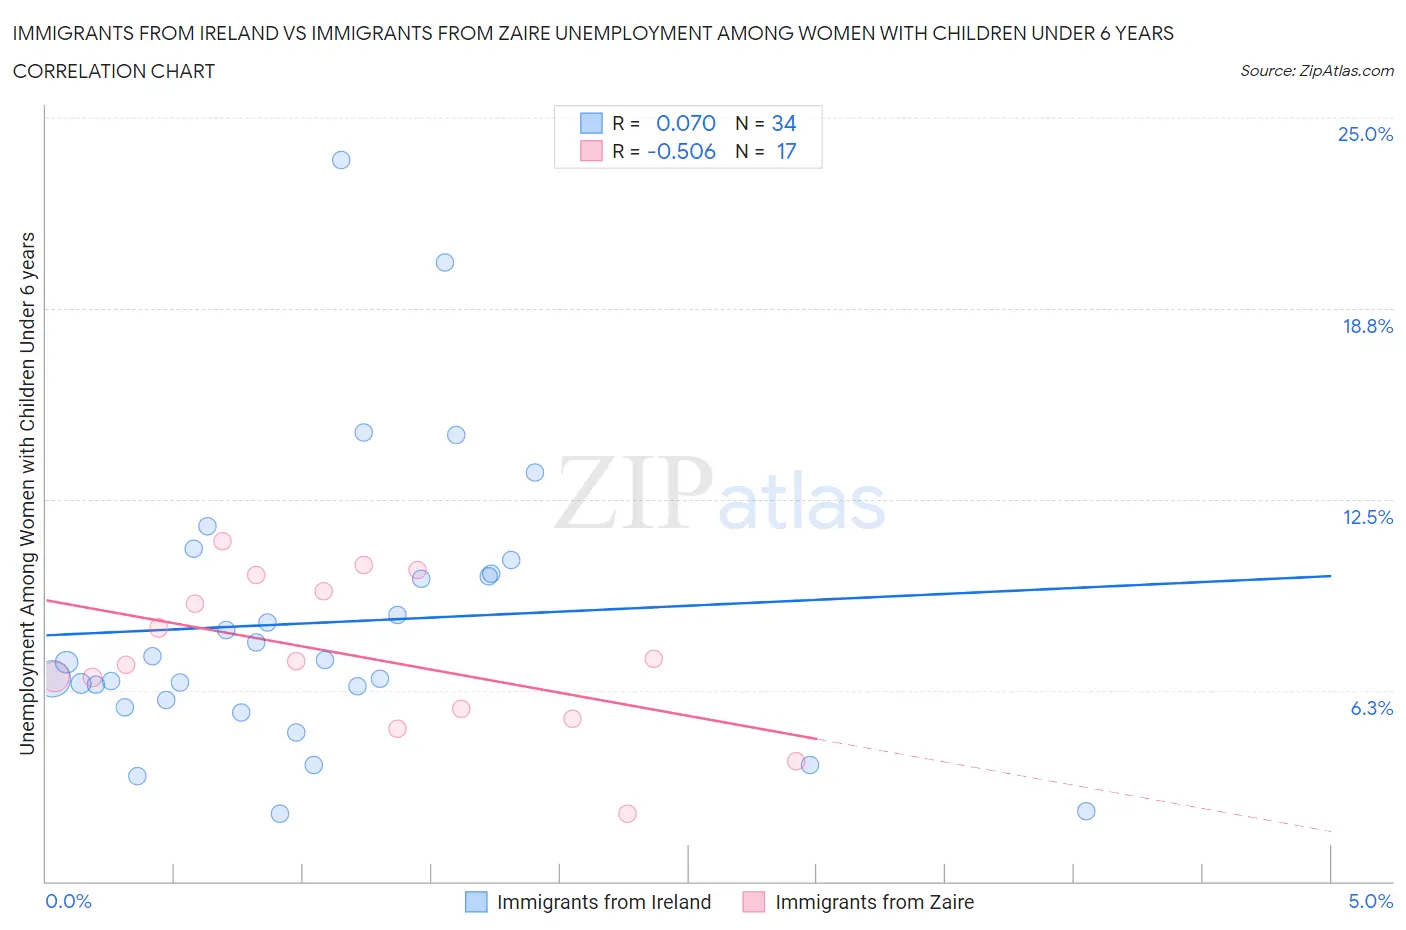
Immigrants from Ireland vs Immigrants from Zaire Unemployment Among Women with Children Under 6 years Correlation Chart
The statistical analysis conducted on geographies consisting of 193,495,691 people shows a slight positive correlation between the proportion of Immigrants from Ireland and unemployment rate among women with children under the age of 6 in the United States with a correlation coefficient (R) of 0.070 and weighted average of 6.8%. Similarly, the statistical analysis conducted on geographies consisting of 97,228,389 people shows a substantial negative correlation between the proportion of Immigrants from Zaire and unemployment rate among women with children under the age of 6 in the United States with a correlation coefficient (R) of -0.506 and weighted average of 7.3%, a difference of 7.8%.
Unemployment Among Women with Children Under 6 years Correlation Summary
| Measurement | Immigrants from Ireland | Immigrants from Zaire |
| Minimum | 2.2% | 2.2% |
| Maximum | 23.6% | 11.1% |
| Range | 21.4% | 8.9% |
| Mean | 8.5% | 7.4% |
| Median | 7.2% | 7.2% |
| Interquartile 25% (IQ1) | 5.9% | 5.5% |
| Interquartile 75% (IQ3) | 10.1% | 9.8% |
| Interquartile Range (IQR) | 4.2% | 4.3% |
| Standard Deviation (Sample) | 4.6% | 2.5% |
| Standard Deviation (Population) | 4.6% | 2.4% |
Similar Demographics by Unemployment Among Women with Children Under 6 years
Demographics Similar to Immigrants from Ireland by Unemployment Among Women with Children Under 6 years
In terms of unemployment among women with children under 6 years, the demographic groups most similar to Immigrants from Ireland are Immigrants from Nepal (6.8%, a difference of 0.010%), Ethiopian (6.8%, a difference of 0.020%), Immigrants from Switzerland (6.8%, a difference of 0.060%), Immigrants from Asia (6.8%, a difference of 0.090%), and Immigrants from Iran (6.8%, a difference of 0.13%).
| Demographics | Rating | Rank | Unemployment Among Women with Children Under 6 years |
| Bhutanese | 99.9 /100 | #43 | Exceptional 6.7% |
| Iranians | 99.9 /100 | #44 | Exceptional 6.7% |
| Immigrants | Australia | 99.9 /100 | #45 | Exceptional 6.8% |
| Latvians | 99.9 /100 | #46 | Exceptional 6.8% |
| Immigrants | Asia | 99.9 /100 | #47 | Exceptional 6.8% |
| Immigrants | Switzerland | 99.9 /100 | #48 | Exceptional 6.8% |
| Immigrants | Nepal | 99.9 /100 | #49 | Exceptional 6.8% |
| Immigrants | Ireland | 99.9 /100 | #50 | Exceptional 6.8% |
| Ethiopians | 99.9 /100 | #51 | Exceptional 6.8% |
| Immigrants | Iran | 99.9 /100 | #52 | Exceptional 6.8% |
| Chinese | 99.9 /100 | #53 | Exceptional 6.8% |
| Immigrants | Latvia | 99.9 /100 | #54 | Exceptional 6.8% |
| Immigrants | Ukraine | 99.8 /100 | #55 | Exceptional 6.8% |
| Immigrants | Ethiopia | 99.8 /100 | #56 | Exceptional 6.9% |
| Icelanders | 99.8 /100 | #57 | Exceptional 6.9% |
Demographics Similar to Immigrants from Zaire by Unemployment Among Women with Children Under 6 years
In terms of unemployment among women with children under 6 years, the demographic groups most similar to Immigrants from Zaire are Immigrants from Bosnia and Herzegovina (7.3%, a difference of 0.050%), Immigrants from Chile (7.3%, a difference of 0.060%), Iraqi (7.3%, a difference of 0.18%), Immigrants from South Africa (7.3%, a difference of 0.20%), and South African (7.3%, a difference of 0.25%).
| Demographics | Rating | Rank | Unemployment Among Women with Children Under 6 years |
| Armenians | 95.9 /100 | #116 | Exceptional 7.2% |
| Immigrants | Kenya | 95.4 /100 | #117 | Exceptional 7.3% |
| Serbians | 94.5 /100 | #118 | Exceptional 7.3% |
| South Africans | 94.1 /100 | #119 | Exceptional 7.3% |
| Iraqis | 93.9 /100 | #120 | Exceptional 7.3% |
| Immigrants | Chile | 93.5 /100 | #121 | Exceptional 7.3% |
| Immigrants | Bosnia and Herzegovina | 93.5 /100 | #122 | Exceptional 7.3% |
| Immigrants | Zaire | 93.3 /100 | #123 | Exceptional 7.3% |
| Immigrants | South Africa | 92.5 /100 | #124 | Exceptional 7.3% |
| Pakistanis | 92.2 /100 | #125 | Exceptional 7.3% |
| Immigrants | Burma/Myanmar | 91.9 /100 | #126 | Exceptional 7.3% |
| Jordanians | 91.5 /100 | #127 | Exceptional 7.3% |
| Zimbabweans | 91.5 /100 | #128 | Exceptional 7.3% |
| Slovenes | 89.2 /100 | #129 | Excellent 7.4% |
| Swedes | 88.4 /100 | #130 | Excellent 7.4% |