Immigrants from Ireland vs Immigrants from Zaire 11th Grade
COMPARE
Immigrants from Ireland
Immigrants from Zaire
11th Grade
11th Grade Comparison
Immigrants from Ireland
Immigrants from Zaire
94.1%
11TH GRADE
99.9/ 100
METRIC RATING
44th/ 347
METRIC RANK
91.9%
11TH GRADE
5.4/ 100
METRIC RATING
225th/ 347
METRIC RANK
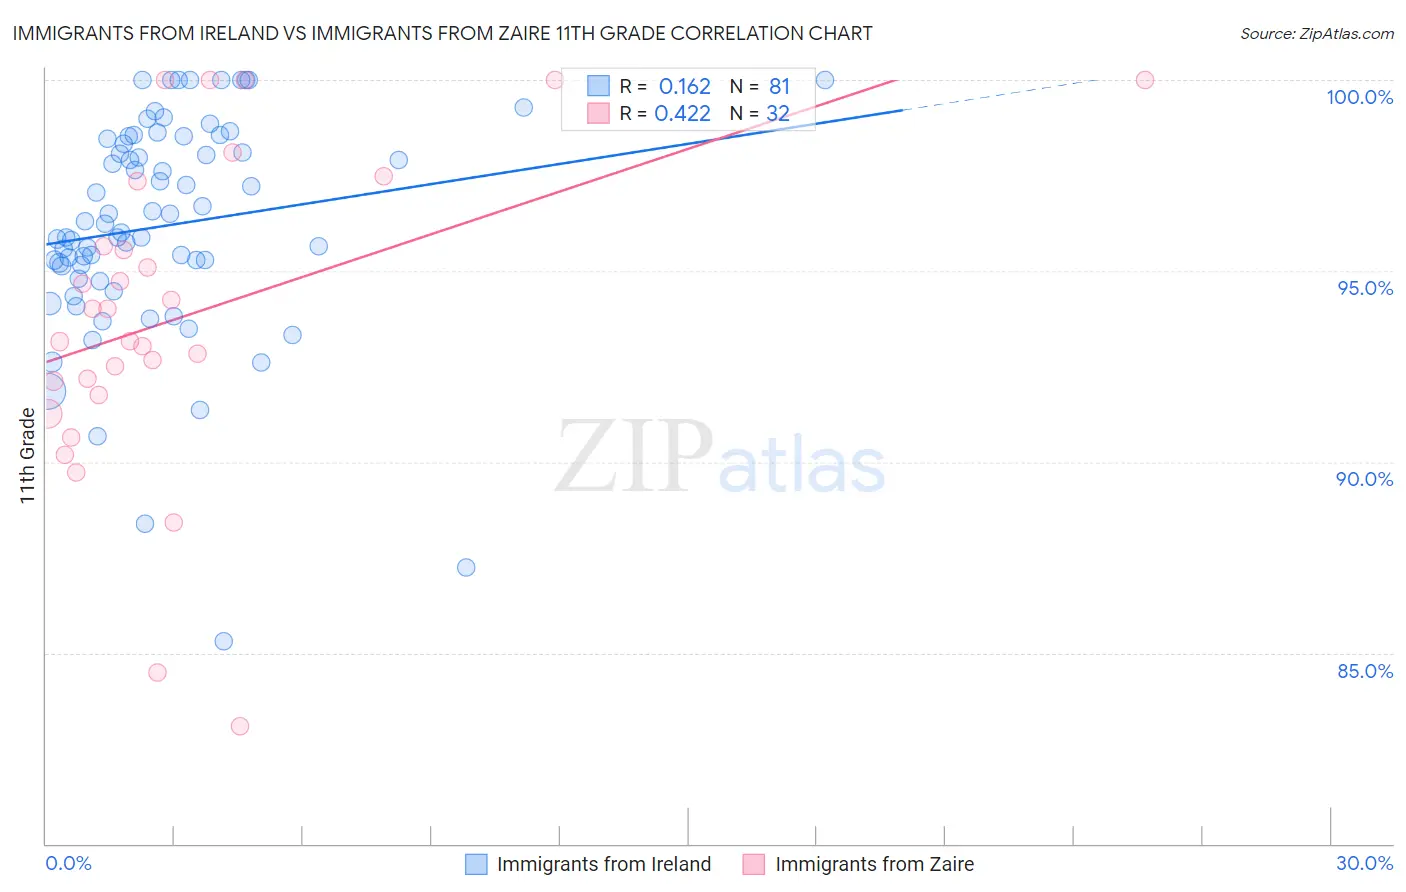
Immigrants from Ireland vs Immigrants from Zaire 11th Grade Correlation Chart
The statistical analysis conducted on geographies consisting of 240,784,498 people shows a poor positive correlation between the proportion of Immigrants from Ireland and percentage of population with at least 11th grade education in the United States with a correlation coefficient (R) of 0.162 and weighted average of 94.1%. Similarly, the statistical analysis conducted on geographies consisting of 107,255,805 people shows a moderate positive correlation between the proportion of Immigrants from Zaire and percentage of population with at least 11th grade education in the United States with a correlation coefficient (R) of 0.422 and weighted average of 91.9%, a difference of 2.4%.
11th Grade Correlation Summary
| Measurement | Immigrants from Ireland | Immigrants from Zaire |
| Minimum | 85.3% | 83.1% |
| Maximum | 100.0% | 100.0% |
| Range | 14.7% | 16.9% |
| Mean | 96.2% | 93.8% |
| Median | 96.2% | 93.6% |
| Interquartile 25% (IQ1) | 95.0% | 91.9% |
| Interquartile 75% (IQ3) | 98.5% | 96.5% |
| Interquartile Range (IQR) | 3.5% | 4.6% |
| Standard Deviation (Sample) | 2.9% | 4.2% |
| Standard Deviation (Population) | 2.9% | 4.1% |
Similar Demographics by 11th Grade
Demographics Similar to Immigrants from Ireland by 11th Grade
In terms of 11th grade, the demographic groups most similar to Immigrants from Ireland are Greek (94.1%, a difference of 0.010%), Australian (94.1%, a difference of 0.010%), Cypriot (94.1%, a difference of 0.020%), Immigrants from Austria (94.1%, a difference of 0.020%), and Serbian (94.1%, a difference of 0.020%).
| Demographics | Rating | Rank | 11th Grade |
| Northern Europeans | 99.9 /100 | #37 | Exceptional 94.2% |
| Hungarians | 99.9 /100 | #38 | Exceptional 94.2% |
| Immigrants | Lithuania | 99.9 /100 | #39 | Exceptional 94.1% |
| Thais | 99.9 /100 | #40 | Exceptional 94.1% |
| Cypriots | 99.9 /100 | #41 | Exceptional 94.1% |
| Immigrants | Austria | 99.9 /100 | #42 | Exceptional 94.1% |
| Greeks | 99.9 /100 | #43 | Exceptional 94.1% |
| Immigrants | Ireland | 99.9 /100 | #44 | Exceptional 94.1% |
| Australians | 99.9 /100 | #45 | Exceptional 94.1% |
| Serbians | 99.9 /100 | #46 | Exceptional 94.1% |
| Filipinos | 99.9 /100 | #47 | Exceptional 94.1% |
| Macedonians | 99.9 /100 | #48 | Exceptional 94.1% |
| Slavs | 99.9 /100 | #49 | Exceptional 94.1% |
| French | 99.9 /100 | #50 | Exceptional 94.1% |
| Turks | 99.9 /100 | #51 | Exceptional 94.0% |
Demographics Similar to Immigrants from Zaire by 11th Grade
In terms of 11th grade, the demographic groups most similar to Immigrants from Zaire are Immigrants from Somalia (91.9%, a difference of 0.010%), Costa Rican (91.9%, a difference of 0.040%), Immigrants from Africa (91.9%, a difference of 0.050%), Immigrants from Bahamas (91.9%, a difference of 0.050%), and Immigrants from Cameroon (91.8%, a difference of 0.060%).
| Demographics | Rating | Rank | 11th Grade |
| Blackfeet | 10.1 /100 | #218 | Poor 92.0% |
| Portuguese | 10.0 /100 | #219 | Tragic 92.0% |
| South American Indians | 7.6 /100 | #220 | Tragic 92.0% |
| Immigrants | Liberia | 7.0 /100 | #221 | Tragic 91.9% |
| Immigrants | Africa | 6.5 /100 | #222 | Tragic 91.9% |
| Immigrants | Bahamas | 6.5 /100 | #223 | Tragic 91.9% |
| Costa Ricans | 6.3 /100 | #224 | Tragic 91.9% |
| Immigrants | Zaire | 5.4 /100 | #225 | Tragic 91.9% |
| Immigrants | Somalia | 5.2 /100 | #226 | Tragic 91.9% |
| Immigrants | Cameroon | 4.4 /100 | #227 | Tragic 91.8% |
| Immigrants | Panama | 4.3 /100 | #228 | Tragic 91.8% |
| Nigerians | 4.3 /100 | #229 | Tragic 91.8% |
| Immigrants | Afghanistan | 3.9 /100 | #230 | Tragic 91.8% |
| Choctaw | 3.7 /100 | #231 | Tragic 91.8% |
| Uruguayans | 3.5 /100 | #232 | Tragic 91.8% |