Immigrants from Ireland vs Belgian Unemployment Among Women with Children Under 6 years
COMPARE
Immigrants from Ireland
Belgian
Unemployment Among Women with Children Under 6 years
Unemployment Among Women with Children Under 6 years Comparison
Immigrants from Ireland
Belgians
6.8%
UNEMPLOYMENT AMONG WOMEN WITH CHILDREN UNDER 6 YEARS
99.9/ 100
METRIC RATING
50th/ 347
METRIC RANK
7.6%
UNEMPLOYMENT AMONG WOMEN WITH CHILDREN UNDER 6 YEARS
63.5/ 100
METRIC RATING
166th/ 347
METRIC RANK
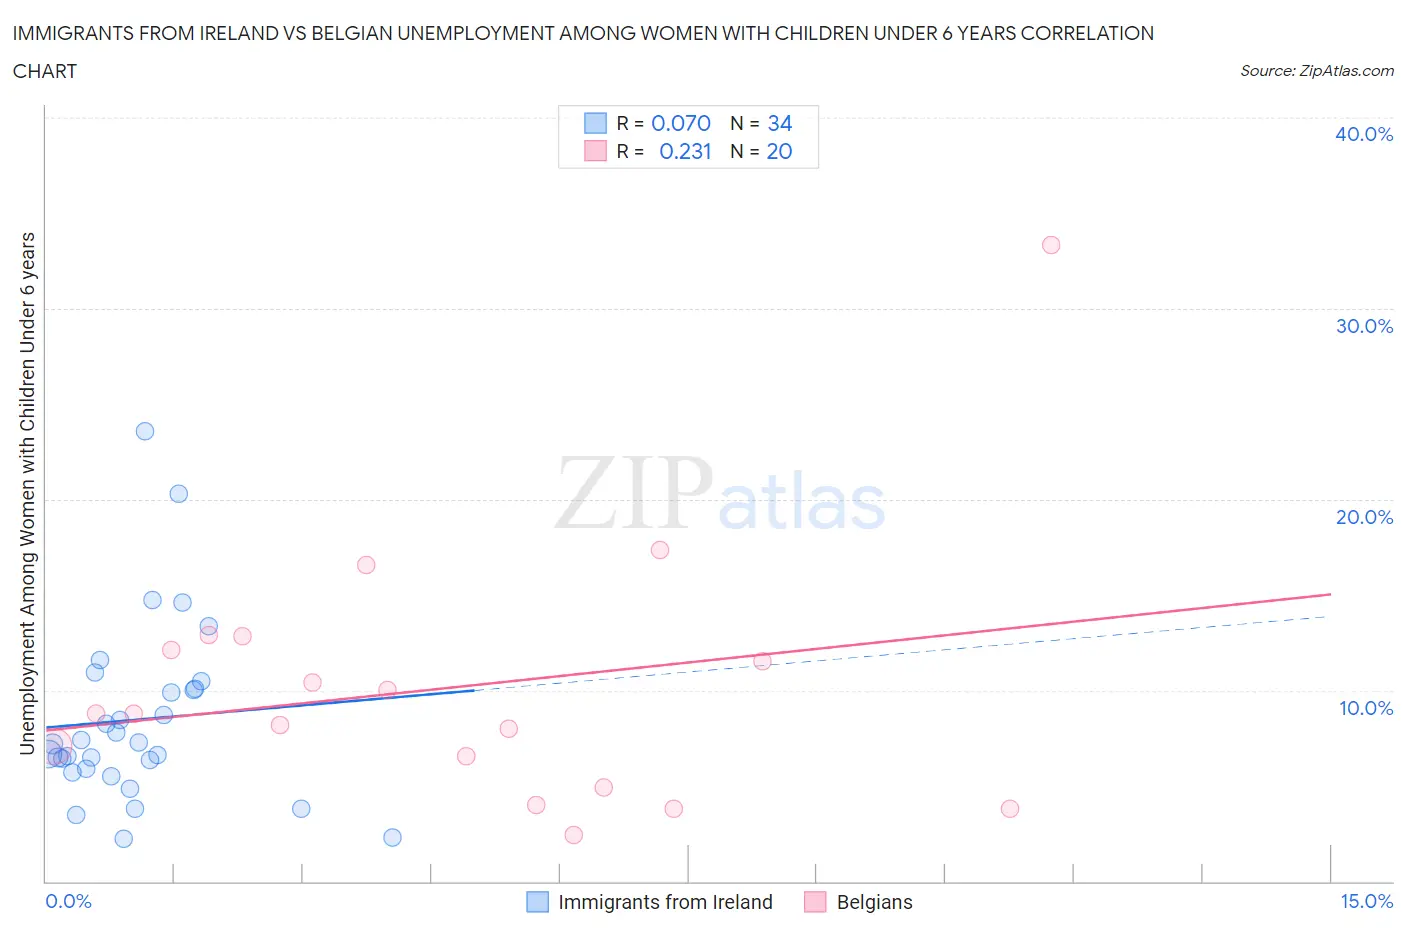
Immigrants from Ireland vs Belgian Unemployment Among Women with Children Under 6 years Correlation Chart
The statistical analysis conducted on geographies consisting of 193,495,691 people shows a slight positive correlation between the proportion of Immigrants from Ireland and unemployment rate among women with children under the age of 6 in the United States with a correlation coefficient (R) of 0.070 and weighted average of 6.8%. Similarly, the statistical analysis conducted on geographies consisting of 265,159,177 people shows a weak positive correlation between the proportion of Belgians and unemployment rate among women with children under the age of 6 in the United States with a correlation coefficient (R) of 0.231 and weighted average of 7.6%, a difference of 11.7%.
Unemployment Among Women with Children Under 6 years Correlation Summary
| Measurement | Immigrants from Ireland | Belgian |
| Minimum | 2.2% | 2.4% |
| Maximum | 23.6% | 33.3% |
| Range | 21.4% | 30.9% |
| Mean | 8.5% | 10.2% |
| Median | 7.2% | 8.8% |
| Interquartile 25% (IQ1) | 5.9% | 5.7% |
| Interquartile 75% (IQ3) | 10.1% | 12.5% |
| Interquartile Range (IQR) | 4.2% | 6.7% |
| Standard Deviation (Sample) | 4.6% | 6.8% |
| Standard Deviation (Population) | 4.6% | 6.7% |
Similar Demographics by Unemployment Among Women with Children Under 6 years
Demographics Similar to Immigrants from Ireland by Unemployment Among Women with Children Under 6 years
In terms of unemployment among women with children under 6 years, the demographic groups most similar to Immigrants from Ireland are Immigrants from Nepal (6.8%, a difference of 0.010%), Ethiopian (6.8%, a difference of 0.020%), Immigrants from Switzerland (6.8%, a difference of 0.060%), Immigrants from Asia (6.8%, a difference of 0.090%), and Immigrants from Iran (6.8%, a difference of 0.13%).
| Demographics | Rating | Rank | Unemployment Among Women with Children Under 6 years |
| Bhutanese | 99.9 /100 | #43 | Exceptional 6.7% |
| Iranians | 99.9 /100 | #44 | Exceptional 6.7% |
| Immigrants | Australia | 99.9 /100 | #45 | Exceptional 6.8% |
| Latvians | 99.9 /100 | #46 | Exceptional 6.8% |
| Immigrants | Asia | 99.9 /100 | #47 | Exceptional 6.8% |
| Immigrants | Switzerland | 99.9 /100 | #48 | Exceptional 6.8% |
| Immigrants | Nepal | 99.9 /100 | #49 | Exceptional 6.8% |
| Immigrants | Ireland | 99.9 /100 | #50 | Exceptional 6.8% |
| Ethiopians | 99.9 /100 | #51 | Exceptional 6.8% |
| Immigrants | Iran | 99.9 /100 | #52 | Exceptional 6.8% |
| Chinese | 99.9 /100 | #53 | Exceptional 6.8% |
| Immigrants | Latvia | 99.9 /100 | #54 | Exceptional 6.8% |
| Immigrants | Ukraine | 99.8 /100 | #55 | Exceptional 6.8% |
| Immigrants | Ethiopia | 99.8 /100 | #56 | Exceptional 6.9% |
| Icelanders | 99.8 /100 | #57 | Exceptional 6.9% |
Demographics Similar to Belgians by Unemployment Among Women with Children Under 6 years
In terms of unemployment among women with children under 6 years, the demographic groups most similar to Belgians are Kenyan (7.6%, a difference of 0.070%), Immigrants from Canada (7.6%, a difference of 0.14%), Immigrants from South America (7.6%, a difference of 0.15%), Immigrants from Scotland (7.6%, a difference of 0.15%), and Ugandan (7.6%, a difference of 0.17%).
| Demographics | Rating | Rank | Unemployment Among Women with Children Under 6 years |
| Immigrants | Philippines | 71.3 /100 | #159 | Good 7.5% |
| Bolivians | 70.8 /100 | #160 | Good 7.5% |
| Immigrants | Western Asia | 70.2 /100 | #161 | Good 7.5% |
| Immigrants | Lithuania | 68.8 /100 | #162 | Good 7.5% |
| British | 66.3 /100 | #163 | Good 7.6% |
| Ugandans | 65.8 /100 | #164 | Good 7.6% |
| Immigrants | South America | 65.6 /100 | #165 | Good 7.6% |
| Belgians | 63.5 /100 | #166 | Good 7.6% |
| Kenyans | 62.5 /100 | #167 | Good 7.6% |
| Immigrants | Canada | 61.6 /100 | #168 | Good 7.6% |
| Immigrants | Scotland | 61.3 /100 | #169 | Good 7.6% |
| Czechs | 59.8 /100 | #170 | Average 7.6% |
| Immigrants | Grenada | 59.0 /100 | #171 | Average 7.6% |
| Immigrants | North America | 57.7 /100 | #172 | Average 7.6% |
| Cree | 51.6 /100 | #173 | Average 7.6% |