Immigrants from Ireland vs Immigrants from Egypt Unemployment Among Ages 60 to 64 years
COMPARE
Immigrants from Ireland
Immigrants from Egypt
Unemployment Among Ages 60 to 64 years
Unemployment Among Ages 60 to 64 years Comparison
Immigrants from Ireland
Immigrants from Egypt
5.0%
UNEMPLOYMENT AMONG AGES 60 TO 64 YEARS
7.2/ 100
METRIC RATING
225th/ 347
METRIC RANK
4.7%
UNEMPLOYMENT AMONG AGES 60 TO 64 YEARS
99.1/ 100
METRIC RATING
83rd/ 347
METRIC RANK
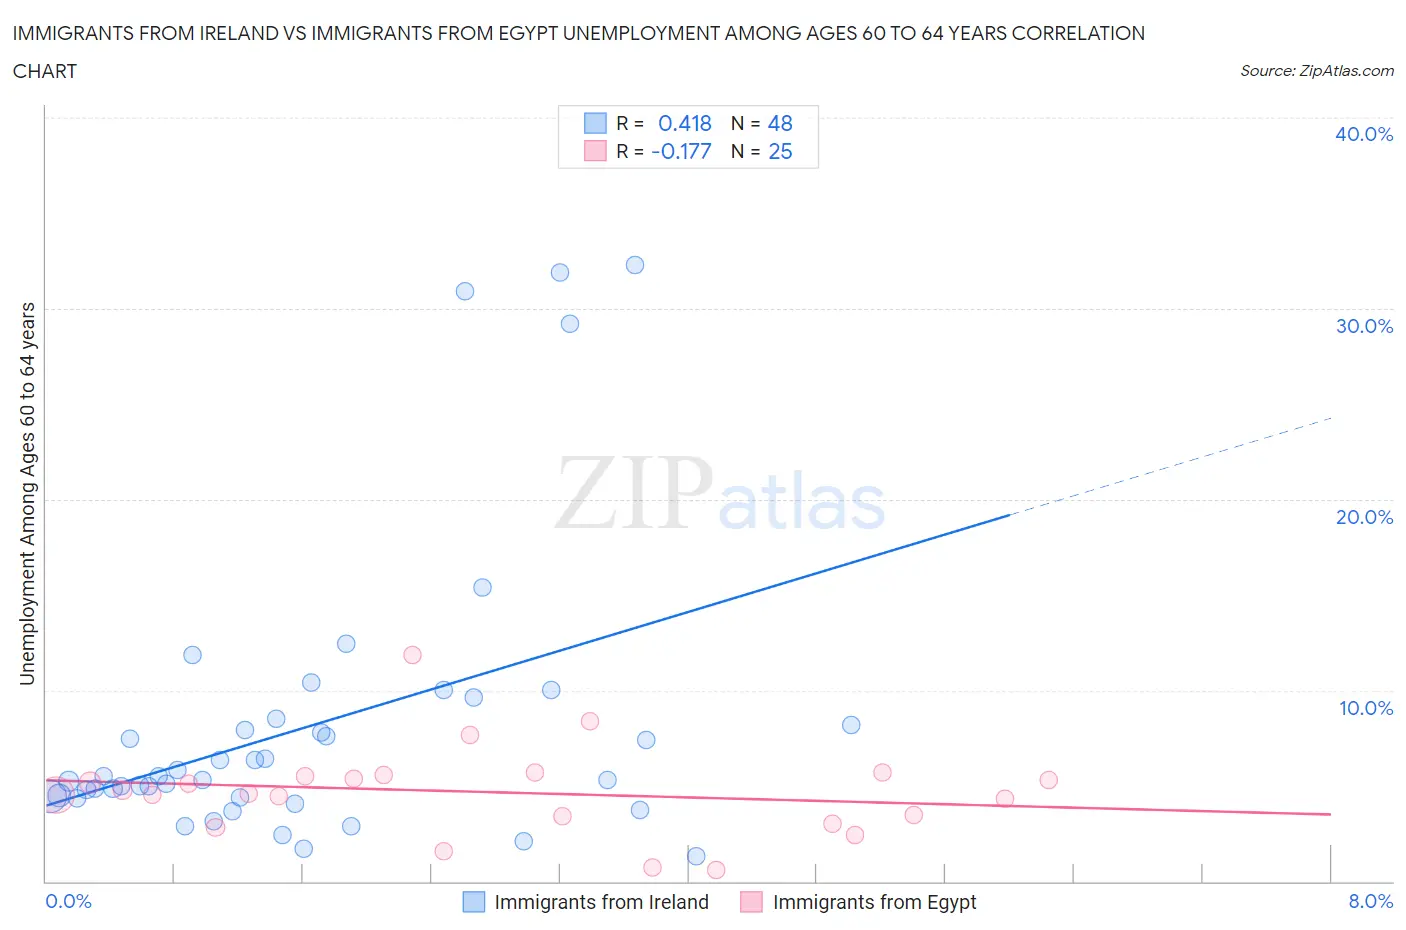
Immigrants from Ireland vs Immigrants from Egypt Unemployment Among Ages 60 to 64 years Correlation Chart
The statistical analysis conducted on geographies consisting of 227,010,209 people shows a moderate positive correlation between the proportion of Immigrants from Ireland and unemployment rate among population between the ages 60 and 64 in the United States with a correlation coefficient (R) of 0.418 and weighted average of 5.0%. Similarly, the statistical analysis conducted on geographies consisting of 233,112,375 people shows a poor negative correlation between the proportion of Immigrants from Egypt and unemployment rate among population between the ages 60 and 64 in the United States with a correlation coefficient (R) of -0.177 and weighted average of 4.7%, a difference of 6.7%.
Unemployment Among Ages 60 to 64 years Correlation Summary
| Measurement | Immigrants from Ireland | Immigrants from Egypt |
| Minimum | 1.3% | 0.60% |
| Maximum | 32.3% | 11.9% |
| Range | 31.0% | 11.3% |
| Mean | 8.1% | 4.7% |
| Median | 5.4% | 4.6% |
| Interquartile 25% (IQ1) | 4.4% | 3.2% |
| Interquartile 75% (IQ3) | 8.3% | 5.5% |
| Interquartile Range (IQR) | 3.9% | 2.3% |
| Standard Deviation (Sample) | 7.6% | 2.4% |
| Standard Deviation (Population) | 7.5% | 2.3% |
Similar Demographics by Unemployment Among Ages 60 to 64 years
Demographics Similar to Immigrants from Ireland by Unemployment Among Ages 60 to 64 years
In terms of unemployment among ages 60 to 64 years, the demographic groups most similar to Immigrants from Ireland are Immigrants from Chile (5.0%, a difference of 0.050%), Nigerian (5.0%, a difference of 0.050%), Immigrants from Belarus (5.0%, a difference of 0.11%), Immigrants from Cameroon (5.0%, a difference of 0.16%), and African (5.0%, a difference of 0.18%).
| Demographics | Rating | Rank | Unemployment Among Ages 60 to 64 years |
| Immigrants | Singapore | 12.0 /100 | #218 | Poor 4.9% |
| Immigrants | Brazil | 11.7 /100 | #219 | Poor 4.9% |
| Ottawa | 11.6 /100 | #220 | Poor 4.9% |
| Ugandans | 10.5 /100 | #221 | Poor 4.9% |
| Brazilians | 10.1 /100 | #222 | Poor 5.0% |
| Crow | 9.7 /100 | #223 | Tragic 5.0% |
| Immigrants | Cameroon | 8.5 /100 | #224 | Tragic 5.0% |
| Immigrants | Ireland | 7.2 /100 | #225 | Tragic 5.0% |
| Immigrants | Chile | 6.8 /100 | #226 | Tragic 5.0% |
| Nigerians | 6.8 /100 | #227 | Tragic 5.0% |
| Immigrants | Belarus | 6.4 /100 | #228 | Tragic 5.0% |
| Africans | 5.9 /100 | #229 | Tragic 5.0% |
| Immigrants | Denmark | 5.8 /100 | #230 | Tragic 5.0% |
| Tohono O'odham | 5.7 /100 | #231 | Tragic 5.0% |
| Immigrants | Eastern Asia | 4.7 /100 | #232 | Tragic 5.0% |
Demographics Similar to Immigrants from Egypt by Unemployment Among Ages 60 to 64 years
In terms of unemployment among ages 60 to 64 years, the demographic groups most similar to Immigrants from Egypt are Iroquois (4.7%, a difference of 0.010%), Okinawan (4.7%, a difference of 0.010%), Icelander (4.7%, a difference of 0.020%), Irish (4.7%, a difference of 0.050%), and Seminole (4.7%, a difference of 0.080%).
| Demographics | Rating | Rank | Unemployment Among Ages 60 to 64 years |
| Slovaks | 99.3 /100 | #76 | Exceptional 4.6% |
| Immigrants | Somalia | 99.2 /100 | #77 | Exceptional 4.6% |
| Seminole | 99.2 /100 | #78 | Exceptional 4.7% |
| Irish | 99.2 /100 | #79 | Exceptional 4.7% |
| Icelanders | 99.1 /100 | #80 | Exceptional 4.7% |
| Iroquois | 99.1 /100 | #81 | Exceptional 4.7% |
| Okinawans | 99.1 /100 | #82 | Exceptional 4.7% |
| Immigrants | Egypt | 99.1 /100 | #83 | Exceptional 4.7% |
| Thais | 98.9 /100 | #84 | Exceptional 4.7% |
| Immigrants | Sri Lanka | 98.9 /100 | #85 | Exceptional 4.7% |
| Immigrants | Oceania | 98.9 /100 | #86 | Exceptional 4.7% |
| Immigrants | Jordan | 98.8 /100 | #87 | Exceptional 4.7% |
| Immigrants | Bulgaria | 98.7 /100 | #88 | Exceptional 4.7% |
| Immigrants | Northern Africa | 98.7 /100 | #89 | Exceptional 4.7% |
| Immigrants | Liberia | 98.7 /100 | #90 | Exceptional 4.7% |