Immigrants from Ireland vs Immigrants from Egypt Unemployment Among Ages 25 to 29 years
COMPARE
Immigrants from Ireland
Immigrants from Egypt
Unemployment Among Ages 25 to 29 years
Unemployment Among Ages 25 to 29 years Comparison
Immigrants from Ireland
Immigrants from Egypt
6.4%
UNEMPLOYMENT AMONG AGES 25 TO 29 YEARS
91.1/ 100
METRIC RATING
101st/ 347
METRIC RANK
6.5%
UNEMPLOYMENT AMONG AGES 25 TO 29 YEARS
87.1/ 100
METRIC RATING
113th/ 347
METRIC RANK
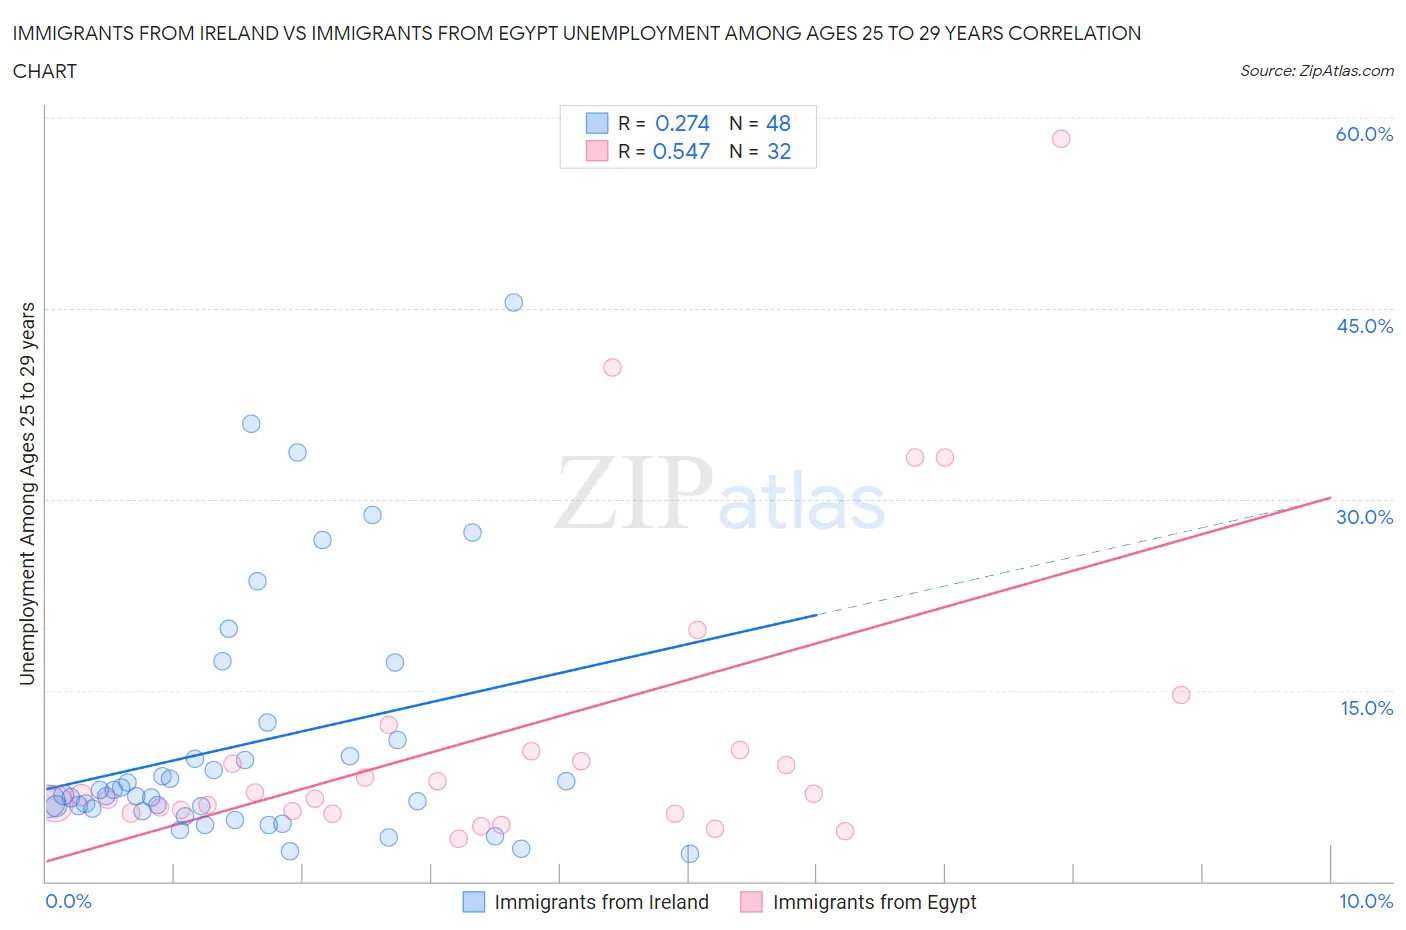
Immigrants from Ireland vs Immigrants from Egypt Unemployment Among Ages 25 to 29 years Correlation Chart
The statistical analysis conducted on geographies consisting of 231,561,774 people shows a weak positive correlation between the proportion of Immigrants from Ireland and unemployment rate among population between the ages 25 and 29 in the United States with a correlation coefficient (R) of 0.274 and weighted average of 6.4%. Similarly, the statistical analysis conducted on geographies consisting of 239,151,709 people shows a substantial positive correlation between the proportion of Immigrants from Egypt and unemployment rate among population between the ages 25 and 29 in the United States with a correlation coefficient (R) of 0.547 and weighted average of 6.5%, a difference of 0.66%.
Unemployment Among Ages 25 to 29 years Correlation Summary
| Measurement | Immigrants from Ireland | Immigrants from Egypt |
| Minimum | 2.2% | 3.3% |
| Maximum | 45.5% | 58.3% |
| Range | 43.3% | 55.0% |
| Mean | 10.8% | 11.7% |
| Median | 6.7% | 6.8% |
| Interquartile 25% (IQ1) | 5.6% | 5.5% |
| Interquartile 75% (IQ3) | 10.4% | 10.2% |
| Interquartile Range (IQR) | 4.9% | 4.8% |
| Standard Deviation (Sample) | 9.8% | 12.4% |
| Standard Deviation (Population) | 9.7% | 12.2% |
Demographics Similar to Immigrants from Ireland and Immigrants from Egypt by Unemployment Among Ages 25 to 29 years
In terms of unemployment among ages 25 to 29 years, the demographic groups most similar to Immigrants from Ireland are Uruguayan (6.4%, a difference of 0.020%), Iraqi (6.4%, a difference of 0.040%), British (6.4%, a difference of 0.12%), Serbian (6.4%, a difference of 0.13%), and Immigrants from Congo (6.4%, a difference of 0.14%). Similarly, the demographic groups most similar to Immigrants from Egypt are Immigrants from Nicaragua (6.4%, a difference of 0.050%), Immigrants from Colombia (6.4%, a difference of 0.070%), European (6.4%, a difference of 0.11%), German (6.5%, a difference of 0.11%), and Immigrants from Albania (6.4%, a difference of 0.12%).
| Demographics | Rating | Rank | Unemployment Among Ages 25 to 29 years |
| Immigrants | Eastern Europe | 91.9 /100 | #97 | Exceptional 6.4% |
| Serbians | 91.7 /100 | #98 | Exceptional 6.4% |
| Iraqis | 91.3 /100 | #99 | Exceptional 6.4% |
| Uruguayans | 91.2 /100 | #100 | Exceptional 6.4% |
| Immigrants | Ireland | 91.1 /100 | #101 | Exceptional 6.4% |
| British | 90.5 /100 | #102 | Exceptional 6.4% |
| Immigrants | Congo | 90.4 /100 | #103 | Exceptional 6.4% |
| Cypriots | 90.1 /100 | #104 | Exceptional 6.4% |
| Immigrants | Kazakhstan | 89.8 /100 | #105 | Excellent 6.4% |
| Immigrants | Hungary | 89.4 /100 | #106 | Excellent 6.4% |
| Swiss | 88.6 /100 | #107 | Excellent 6.4% |
| Croatians | 88.2 /100 | #108 | Excellent 6.4% |
| Immigrants | Albania | 87.9 /100 | #109 | Excellent 6.4% |
| Europeans | 87.8 /100 | #110 | Excellent 6.4% |
| Immigrants | Colombia | 87.6 /100 | #111 | Excellent 6.4% |
| Immigrants | Nicaragua | 87.5 /100 | #112 | Excellent 6.4% |
| Immigrants | Egypt | 87.1 /100 | #113 | Excellent 6.5% |
| Germans | 86.3 /100 | #114 | Excellent 6.5% |
| Macedonians | 86.1 /100 | #115 | Excellent 6.5% |
| Pakistanis | 85.9 /100 | #116 | Excellent 6.5% |
| Immigrants | Uruguay | 85.7 /100 | #117 | Excellent 6.5% |