U.S. Virgin Islander vs Immigrants from Egypt Unemployment Among Ages 60 to 64 years
COMPARE
U.S. Virgin Islander
Immigrants from Egypt
Unemployment Among Ages 60 to 64 years
Unemployment Among Ages 60 to 64 years Comparison
U.S. Virgin Islanders
Immigrants from Egypt
5.5%
UNEMPLOYMENT AMONG AGES 60 TO 64 YEARS
0.0/ 100
METRIC RATING
311th/ 347
METRIC RANK
4.7%
UNEMPLOYMENT AMONG AGES 60 TO 64 YEARS
99.1/ 100
METRIC RATING
83rd/ 347
METRIC RANK
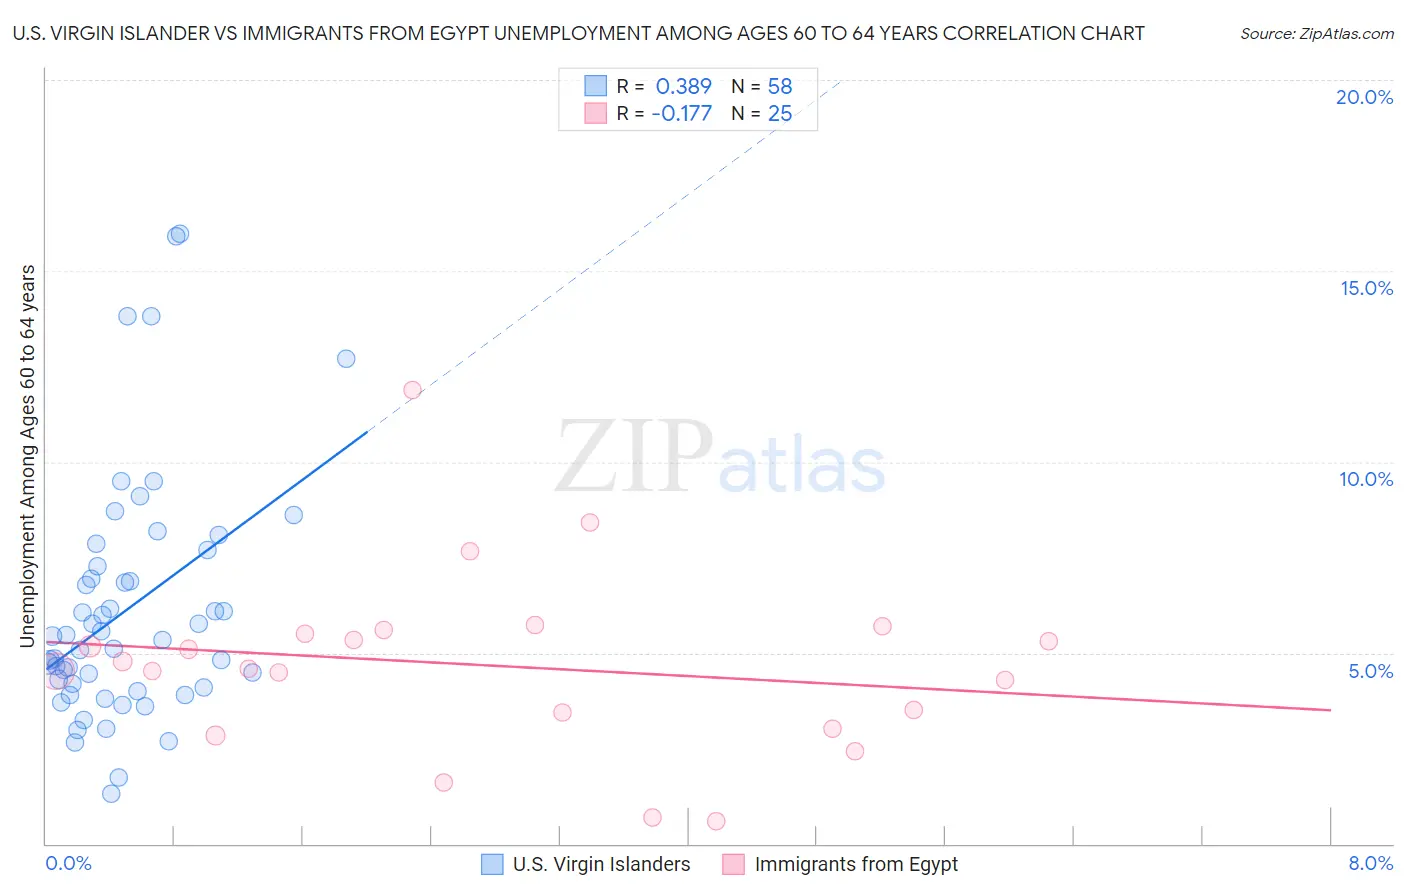
U.S. Virgin Islander vs Immigrants from Egypt Unemployment Among Ages 60 to 64 years Correlation Chart
The statistical analysis conducted on geographies consisting of 85,222,244 people shows a mild positive correlation between the proportion of U.S. Virgin Islanders and unemployment rate among population between the ages 60 and 64 in the United States with a correlation coefficient (R) of 0.389 and weighted average of 5.5%. Similarly, the statistical analysis conducted on geographies consisting of 233,112,375 people shows a poor negative correlation between the proportion of Immigrants from Egypt and unemployment rate among population between the ages 60 and 64 in the United States with a correlation coefficient (R) of -0.177 and weighted average of 4.7%, a difference of 17.3%.
Unemployment Among Ages 60 to 64 years Correlation Summary
| Measurement | U.S. Virgin Islander | Immigrants from Egypt |
| Minimum | 1.3% | 0.60% |
| Maximum | 16.0% | 11.9% |
| Range | 14.7% | 11.3% |
| Mean | 6.1% | 4.7% |
| Median | 5.4% | 4.6% |
| Interquartile 25% (IQ1) | 4.1% | 3.2% |
| Interquartile 75% (IQ3) | 7.3% | 5.5% |
| Interquartile Range (IQR) | 3.2% | 2.3% |
| Standard Deviation (Sample) | 3.2% | 2.4% |
| Standard Deviation (Population) | 3.2% | 2.3% |
Similar Demographics by Unemployment Among Ages 60 to 64 years
Demographics Similar to U.S. Virgin Islanders by Unemployment Among Ages 60 to 64 years
In terms of unemployment among ages 60 to 64 years, the demographic groups most similar to U.S. Virgin Islanders are British West Indian (5.5%, a difference of 0.020%), Immigrants from West Indies (5.5%, a difference of 0.19%), Belizean (5.5%, a difference of 0.89%), Soviet Union (5.4%, a difference of 0.94%), and Spanish American Indian (5.4%, a difference of 0.95%).
| Demographics | Rating | Rank | Unemployment Among Ages 60 to 64 years |
| Immigrants | Mexico | 0.0 /100 | #304 | Tragic 5.4% |
| Cypriots | 0.0 /100 | #305 | Tragic 5.4% |
| Immigrants | Dominica | 0.0 /100 | #306 | Tragic 5.4% |
| Immigrants | Guyana | 0.0 /100 | #307 | Tragic 5.4% |
| Spanish American Indians | 0.0 /100 | #308 | Tragic 5.4% |
| Soviet Union | 0.0 /100 | #309 | Tragic 5.4% |
| British West Indians | 0.0 /100 | #310 | Tragic 5.5% |
| U.S. Virgin Islanders | 0.0 /100 | #311 | Tragic 5.5% |
| Immigrants | West Indies | 0.0 /100 | #312 | Tragic 5.5% |
| Belizeans | 0.0 /100 | #313 | Tragic 5.5% |
| Guyanese | 0.0 /100 | #314 | Tragic 5.5% |
| Cree | 0.0 /100 | #315 | Tragic 5.6% |
| Cheyenne | 0.0 /100 | #316 | Tragic 5.6% |
| Shoshone | 0.0 /100 | #317 | Tragic 5.7% |
| Natives/Alaskans | 0.0 /100 | #318 | Tragic 5.7% |
Demographics Similar to Immigrants from Egypt by Unemployment Among Ages 60 to 64 years
In terms of unemployment among ages 60 to 64 years, the demographic groups most similar to Immigrants from Egypt are Iroquois (4.7%, a difference of 0.010%), Okinawan (4.7%, a difference of 0.010%), Icelander (4.7%, a difference of 0.020%), Irish (4.7%, a difference of 0.050%), and Seminole (4.7%, a difference of 0.080%).
| Demographics | Rating | Rank | Unemployment Among Ages 60 to 64 years |
| Slovaks | 99.3 /100 | #76 | Exceptional 4.6% |
| Immigrants | Somalia | 99.2 /100 | #77 | Exceptional 4.6% |
| Seminole | 99.2 /100 | #78 | Exceptional 4.7% |
| Irish | 99.2 /100 | #79 | Exceptional 4.7% |
| Icelanders | 99.1 /100 | #80 | Exceptional 4.7% |
| Iroquois | 99.1 /100 | #81 | Exceptional 4.7% |
| Okinawans | 99.1 /100 | #82 | Exceptional 4.7% |
| Immigrants | Egypt | 99.1 /100 | #83 | Exceptional 4.7% |
| Thais | 98.9 /100 | #84 | Exceptional 4.7% |
| Immigrants | Sri Lanka | 98.9 /100 | #85 | Exceptional 4.7% |
| Immigrants | Oceania | 98.9 /100 | #86 | Exceptional 4.7% |
| Immigrants | Jordan | 98.8 /100 | #87 | Exceptional 4.7% |
| Immigrants | Bulgaria | 98.7 /100 | #88 | Exceptional 4.7% |
| Immigrants | Northern Africa | 98.7 /100 | #89 | Exceptional 4.7% |
| Immigrants | Liberia | 98.7 /100 | #90 | Exceptional 4.7% |