Immigrants from Ireland vs Puerto Rican Unemployment Among Ages 60 to 64 years
COMPARE
Immigrants from Ireland
Puerto Rican
Unemployment Among Ages 60 to 64 years
Unemployment Among Ages 60 to 64 years Comparison
Immigrants from Ireland
Puerto Ricans
5.0%
UNEMPLOYMENT AMONG AGES 60 TO 64 YEARS
7.2/ 100
METRIC RATING
225th/ 347
METRIC RANK
6.1%
UNEMPLOYMENT AMONG AGES 60 TO 64 YEARS
0.0/ 100
METRIC RATING
334th/ 347
METRIC RANK
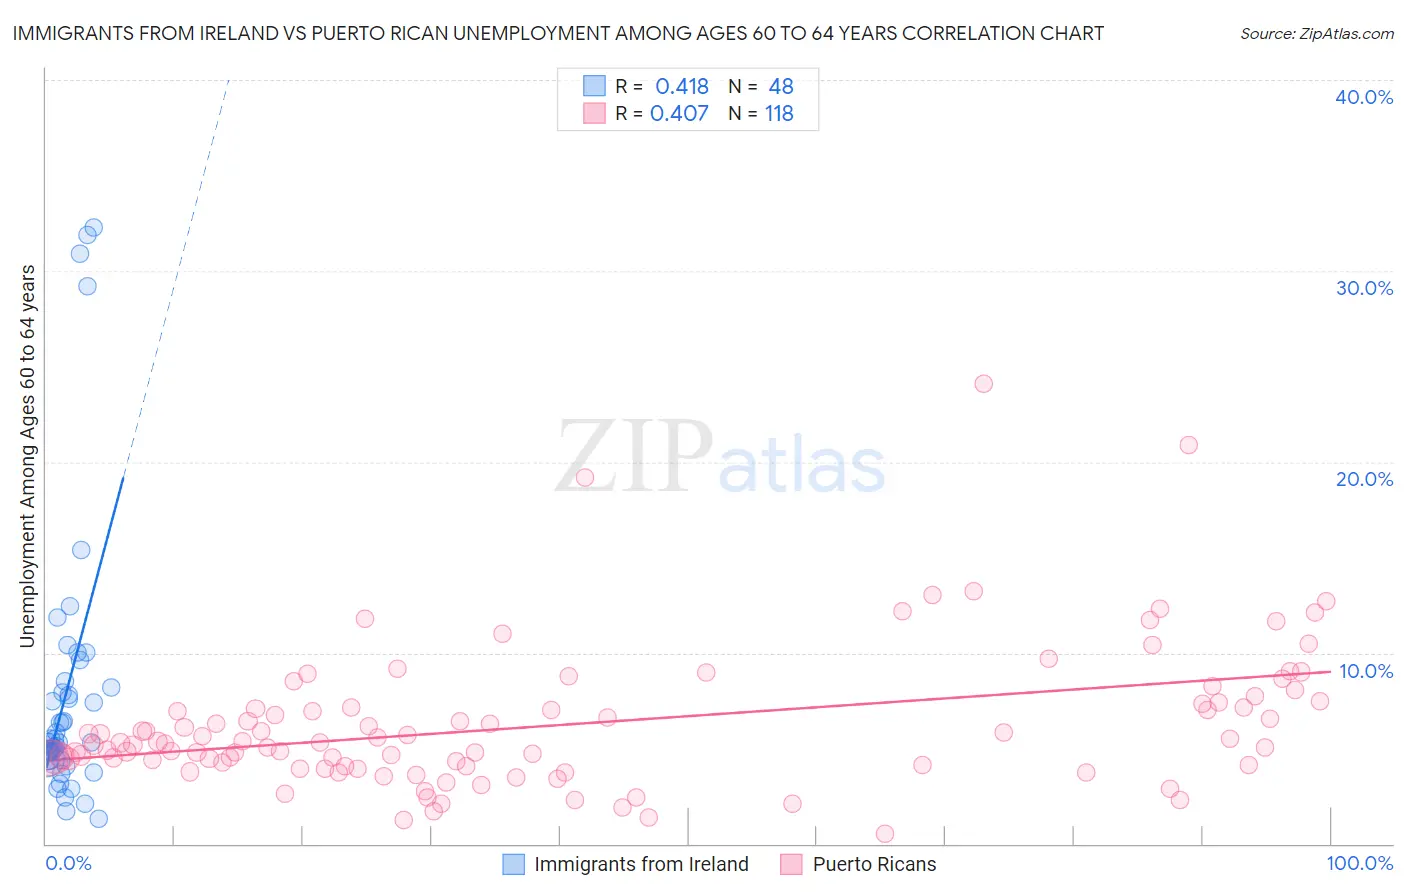
Immigrants from Ireland vs Puerto Rican Unemployment Among Ages 60 to 64 years Correlation Chart
The statistical analysis conducted on geographies consisting of 227,010,209 people shows a moderate positive correlation between the proportion of Immigrants from Ireland and unemployment rate among population between the ages 60 and 64 in the United States with a correlation coefficient (R) of 0.418 and weighted average of 5.0%. Similarly, the statistical analysis conducted on geographies consisting of 450,198,803 people shows a moderate positive correlation between the proportion of Puerto Ricans and unemployment rate among population between the ages 60 and 64 in the United States with a correlation coefficient (R) of 0.407 and weighted average of 6.1%, a difference of 22.2%.
Unemployment Among Ages 60 to 64 years Correlation Summary
| Measurement | Immigrants from Ireland | Puerto Rican |
| Minimum | 1.3% | 0.50% |
| Maximum | 32.3% | 24.1% |
| Range | 31.0% | 23.6% |
| Mean | 8.1% | 6.3% |
| Median | 5.4% | 5.3% |
| Interquartile 25% (IQ1) | 4.4% | 4.1% |
| Interquartile 75% (IQ3) | 8.3% | 7.3% |
| Interquartile Range (IQR) | 3.9% | 3.2% |
| Standard Deviation (Sample) | 7.6% | 3.7% |
| Standard Deviation (Population) | 7.5% | 3.7% |
Similar Demographics by Unemployment Among Ages 60 to 64 years
Demographics Similar to Immigrants from Ireland by Unemployment Among Ages 60 to 64 years
In terms of unemployment among ages 60 to 64 years, the demographic groups most similar to Immigrants from Ireland are Immigrants from Chile (5.0%, a difference of 0.050%), Nigerian (5.0%, a difference of 0.050%), Immigrants from Belarus (5.0%, a difference of 0.11%), Immigrants from Cameroon (5.0%, a difference of 0.16%), and African (5.0%, a difference of 0.18%).
| Demographics | Rating | Rank | Unemployment Among Ages 60 to 64 years |
| Immigrants | Singapore | 12.0 /100 | #218 | Poor 4.9% |
| Immigrants | Brazil | 11.7 /100 | #219 | Poor 4.9% |
| Ottawa | 11.6 /100 | #220 | Poor 4.9% |
| Ugandans | 10.5 /100 | #221 | Poor 4.9% |
| Brazilians | 10.1 /100 | #222 | Poor 5.0% |
| Crow | 9.7 /100 | #223 | Tragic 5.0% |
| Immigrants | Cameroon | 8.5 /100 | #224 | Tragic 5.0% |
| Immigrants | Ireland | 7.2 /100 | #225 | Tragic 5.0% |
| Immigrants | Chile | 6.8 /100 | #226 | Tragic 5.0% |
| Nigerians | 6.8 /100 | #227 | Tragic 5.0% |
| Immigrants | Belarus | 6.4 /100 | #228 | Tragic 5.0% |
| Africans | 5.9 /100 | #229 | Tragic 5.0% |
| Immigrants | Denmark | 5.8 /100 | #230 | Tragic 5.0% |
| Tohono O'odham | 5.7 /100 | #231 | Tragic 5.0% |
| Immigrants | Eastern Asia | 4.7 /100 | #232 | Tragic 5.0% |
Demographics Similar to Puerto Ricans by Unemployment Among Ages 60 to 64 years
In terms of unemployment among ages 60 to 64 years, the demographic groups most similar to Puerto Ricans are Vietnamese (6.1%, a difference of 0.19%), Immigrants from Dominican Republic (6.0%, a difference of 1.2%), Dominican (6.0%, a difference of 1.6%), Yakama (6.0%, a difference of 1.6%), and Immigrants from Armenia (6.0%, a difference of 1.7%).
| Demographics | Rating | Rank | Unemployment Among Ages 60 to 64 years |
| Immigrants | Grenada | 0.0 /100 | #327 | Tragic 5.9% |
| Apache | 0.0 /100 | #328 | Tragic 6.0% |
| Immigrants | Bangladesh | 0.0 /100 | #329 | Tragic 6.0% |
| Immigrants | Armenia | 0.0 /100 | #330 | Tragic 6.0% |
| Yakama | 0.0 /100 | #331 | Tragic 6.0% |
| Dominicans | 0.0 /100 | #332 | Tragic 6.0% |
| Immigrants | Dominican Republic | 0.0 /100 | #333 | Tragic 6.0% |
| Puerto Ricans | 0.0 /100 | #334 | Tragic 6.1% |
| Vietnamese | 0.0 /100 | #335 | Tragic 6.1% |
| Kiowa | 0.0 /100 | #336 | Tragic 6.2% |
| Navajo | 0.0 /100 | #337 | Tragic 6.3% |
| Arapaho | 0.0 /100 | #338 | Tragic 6.3% |
| Tlingit-Haida | 0.0 /100 | #339 | Tragic 6.4% |
| Pueblo | 0.0 /100 | #340 | Tragic 6.7% |
| Yuman | 0.0 /100 | #341 | Tragic 6.8% |