Immigrants from Ireland vs Scandinavian Male Unemployment
COMPARE
Immigrants from Ireland
Scandinavian
Male Unemployment
Male Unemployment Comparison
Immigrants from Ireland
Scandinavians
5.3%
MALE UNEMPLOYMENT
57.7/ 100
METRIC RATING
168th/ 347
METRIC RANK
4.7%
MALE UNEMPLOYMENT
100.0/ 100
METRIC RATING
15th/ 347
METRIC RANK
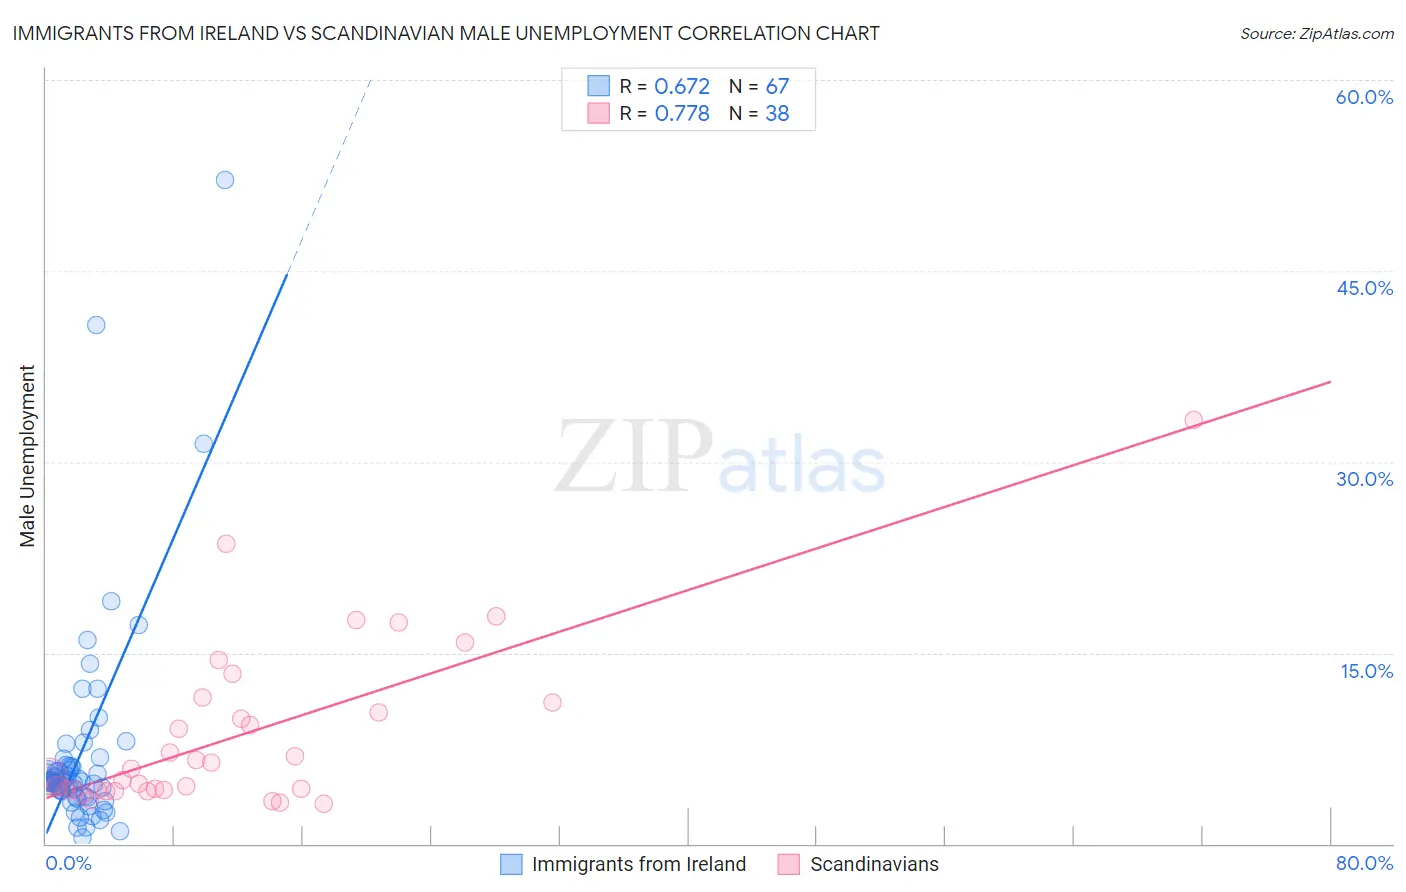
Immigrants from Ireland vs Scandinavian Male Unemployment Correlation Chart
The statistical analysis conducted on geographies consisting of 240,228,125 people shows a significant positive correlation between the proportion of Immigrants from Ireland and unemployment rate among males in the United States with a correlation coefficient (R) of 0.672 and weighted average of 5.3%. Similarly, the statistical analysis conducted on geographies consisting of 467,906,734 people shows a strong positive correlation between the proportion of Scandinavians and unemployment rate among males in the United States with a correlation coefficient (R) of 0.778 and weighted average of 4.7%, a difference of 12.0%.
Male Unemployment Correlation Summary
| Measurement | Immigrants from Ireland | Scandinavian |
| Minimum | 0.50% | 3.1% |
| Maximum | 52.1% | 33.3% |
| Range | 51.6% | 30.2% |
| Mean | 7.2% | 8.6% |
| Median | 4.9% | 5.6% |
| Interquartile 25% (IQ1) | 3.7% | 4.2% |
| Interquartile 75% (IQ3) | 6.2% | 11.1% |
| Interquartile Range (IQR) | 2.5% | 6.9% |
| Standard Deviation (Sample) | 8.5% | 6.6% |
| Standard Deviation (Population) | 8.4% | 6.5% |
Similar Demographics by Male Unemployment
Demographics Similar to Immigrants from Ireland by Male Unemployment
In terms of male unemployment, the demographic groups most similar to Immigrants from Ireland are Immigrants from Vietnam (5.3%, a difference of 0.020%), Immigrants from Congo (5.3%, a difference of 0.020%), Immigrants from Morocco (5.3%, a difference of 0.15%), South American (5.3%, a difference of 0.18%), and Immigrants from Eastern Europe (5.3%, a difference of 0.22%).
| Demographics | Rating | Rank | Male Unemployment |
| Immigrants | China | 70.6 /100 | #161 | Good 5.2% |
| Immigrants | Egypt | 65.9 /100 | #162 | Good 5.2% |
| Immigrants | Hong Kong | 65.7 /100 | #163 | Good 5.2% |
| Afghans | 62.0 /100 | #164 | Good 5.3% |
| South Americans | 60.6 /100 | #165 | Good 5.3% |
| Immigrants | Morocco | 60.2 /100 | #166 | Good 5.3% |
| Immigrants | Vietnam | 58.1 /100 | #167 | Average 5.3% |
| Immigrants | Ireland | 57.7 /100 | #168 | Average 5.3% |
| Immigrants | Congo | 57.4 /100 | #169 | Average 5.3% |
| Immigrants | Eastern Europe | 54.1 /100 | #170 | Average 5.3% |
| Peruvians | 51.9 /100 | #171 | Average 5.3% |
| Immigrants | Kazakhstan | 50.8 /100 | #172 | Average 5.3% |
| Immigrants | Russia | 50.7 /100 | #173 | Average 5.3% |
| Immigrants | Iran | 50.0 /100 | #174 | Average 5.3% |
| Immigrants | Iraq | 48.1 /100 | #175 | Average 5.3% |
Demographics Similar to Scandinavians by Male Unemployment
In terms of male unemployment, the demographic groups most similar to Scandinavians are Swiss (4.7%, a difference of 0.050%), German (4.7%, a difference of 0.27%), Bolivian (4.7%, a difference of 0.29%), Filipino (4.7%, a difference of 0.78%), and Immigrants from Bolivia (4.7%, a difference of 0.97%).
| Demographics | Rating | Rank | Male Unemployment |
| Luxembourgers | 100.0 /100 | #8 | Exceptional 4.5% |
| Thais | 100.0 /100 | #9 | Exceptional 4.6% |
| Cubans | 100.0 /100 | #10 | Exceptional 4.6% |
| Swedes | 100.0 /100 | #11 | Exceptional 4.6% |
| Immigrants | Bolivia | 100.0 /100 | #12 | Exceptional 4.7% |
| Bolivians | 100.0 /100 | #13 | Exceptional 4.7% |
| Germans | 100.0 /100 | #14 | Exceptional 4.7% |
| Scandinavians | 100.0 /100 | #15 | Exceptional 4.7% |
| Swiss | 99.9 /100 | #16 | Exceptional 4.7% |
| Filipinos | 99.9 /100 | #17 | Exceptional 4.7% |
| English | 99.9 /100 | #18 | Exceptional 4.8% |
| Europeans | 99.9 /100 | #19 | Exceptional 4.8% |
| Pennsylvania Germans | 99.9 /100 | #20 | Exceptional 4.8% |
| Immigrants | Taiwan | 99.9 /100 | #21 | Exceptional 4.8% |
| Carpatho Rusyns | 99.9 /100 | #22 | Exceptional 4.8% |