Immigrants from England vs Vietnamese Female Unemployment
COMPARE
Immigrants from England
Vietnamese
Female Unemployment
Female Unemployment Comparison
Immigrants from England
Vietnamese
5.0%
FEMALE UNEMPLOYMENT
93.6/ 100
METRIC RATING
105th/ 347
METRIC RANK
6.5%
FEMALE UNEMPLOYMENT
0.0/ 100
METRIC RATING
322nd/ 347
METRIC RANK
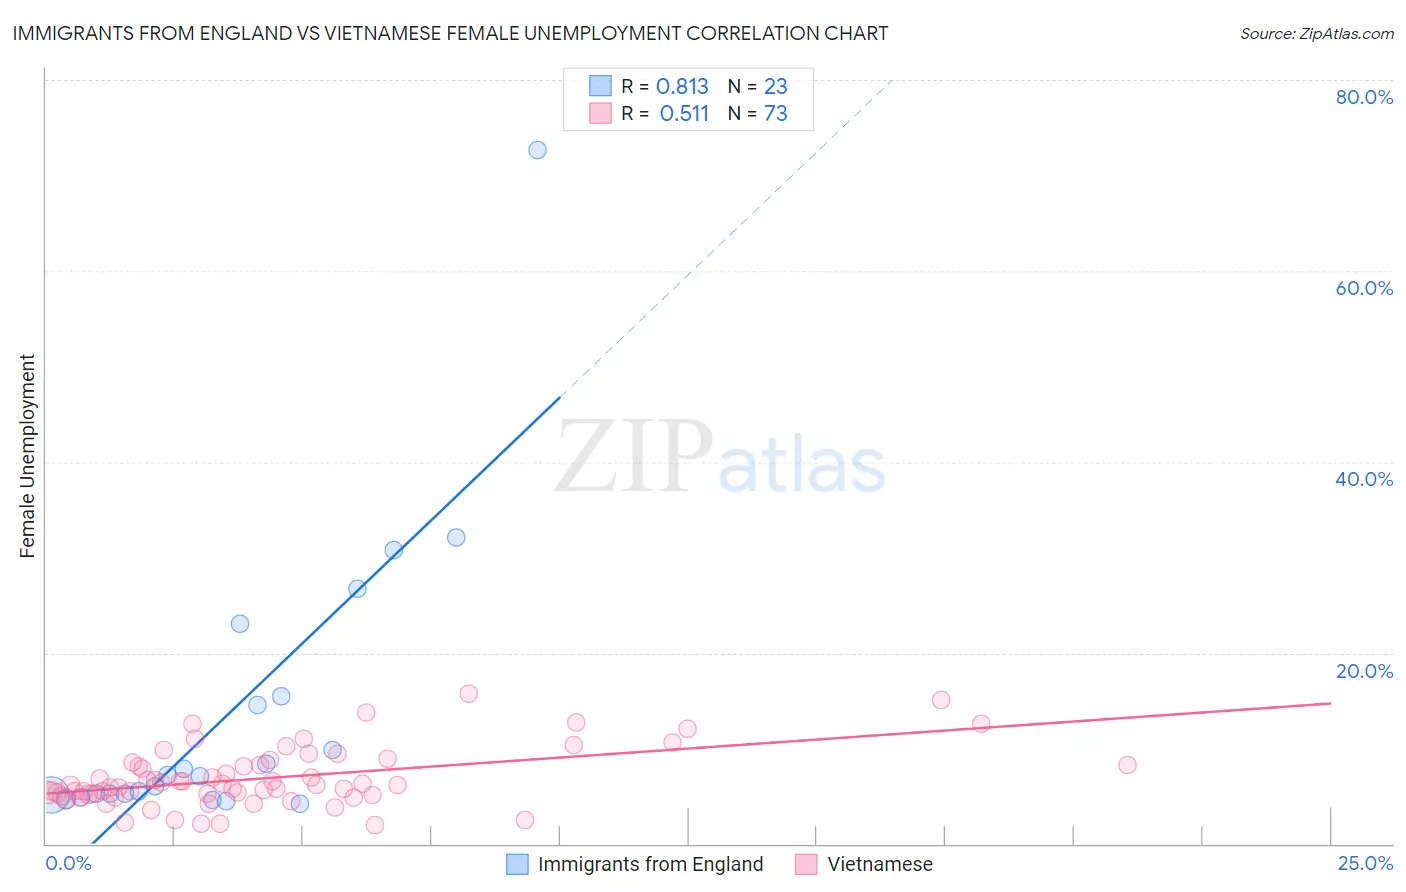
Immigrants from England vs Vietnamese Female Unemployment Correlation Chart
The statistical analysis conducted on geographies consisting of 389,797,734 people shows a very strong positive correlation between the proportion of Immigrants from England and unemploymnet rate among females in the United States with a correlation coefficient (R) of 0.813 and weighted average of 5.0%. Similarly, the statistical analysis conducted on geographies consisting of 170,617,487 people shows a substantial positive correlation between the proportion of Vietnamese and unemploymnet rate among females in the United States with a correlation coefficient (R) of 0.511 and weighted average of 6.5%, a difference of 28.7%.
Female Unemployment Correlation Summary
| Measurement | Immigrants from England | Vietnamese |
| Minimum | 4.2% | 1.9% |
| Maximum | 72.7% | 15.7% |
| Range | 68.5% | 13.8% |
| Mean | 13.5% | 6.9% |
| Median | 7.1% | 6.1% |
| Interquartile 25% (IQ1) | 5.1% | 5.1% |
| Interquartile 75% (IQ3) | 15.4% | 8.4% |
| Interquartile Range (IQR) | 10.3% | 3.3% |
| Standard Deviation (Sample) | 15.6% | 3.0% |
| Standard Deviation (Population) | 15.3% | 3.0% |
Similar Demographics by Female Unemployment
Demographics Similar to Immigrants from England by Female Unemployment
In terms of female unemployment, the demographic groups most similar to Immigrants from England are Kenyan (5.0%, a difference of 0.020%), Paraguayan (5.1%, a difference of 0.090%), Immigrants from Switzerland (5.1%, a difference of 0.12%), Puget Sound Salish (5.1%, a difference of 0.14%), and Immigrants from Eastern Africa (5.1%, a difference of 0.19%).
| Demographics | Rating | Rank | Female Unemployment |
| Immigrants | Kuwait | 95.2 /100 | #98 | Exceptional 5.0% |
| Immigrants | Zaire | 95.2 /100 | #99 | Exceptional 5.0% |
| Indonesians | 95.1 /100 | #100 | Exceptional 5.0% |
| Immigrants | Czechoslovakia | 95.0 /100 | #101 | Exceptional 5.0% |
| Immigrants | Kenya | 94.8 /100 | #102 | Exceptional 5.0% |
| Somalis | 94.6 /100 | #103 | Exceptional 5.0% |
| Kenyans | 93.7 /100 | #104 | Exceptional 5.0% |
| Immigrants | England | 93.6 /100 | #105 | Exceptional 5.0% |
| Paraguayans | 93.2 /100 | #106 | Exceptional 5.1% |
| Immigrants | Switzerland | 93.1 /100 | #107 | Exceptional 5.1% |
| Puget Sound Salish | 93.0 /100 | #108 | Exceptional 5.1% |
| Immigrants | Eastern Africa | 92.8 /100 | #109 | Exceptional 5.1% |
| Macedonians | 92.4 /100 | #110 | Exceptional 5.1% |
| Immigrants | Burma/Myanmar | 92.3 /100 | #111 | Exceptional 5.1% |
| Estonians | 92.1 /100 | #112 | Exceptional 5.1% |
Demographics Similar to Vietnamese by Female Unemployment
In terms of female unemployment, the demographic groups most similar to Vietnamese are Black/African American (6.5%, a difference of 0.080%), Immigrants from Belize (6.5%, a difference of 0.10%), Immigrants from Dominica (6.5%, a difference of 0.62%), Immigrants from Bangladesh (6.5%, a difference of 0.63%), and British West Indian (6.4%, a difference of 0.82%).
| Demographics | Rating | Rank | Female Unemployment |
| Pueblo | 0.0 /100 | #315 | Tragic 6.4% |
| Houma | 0.0 /100 | #316 | Tragic 6.4% |
| Immigrants | St. Vincent and the Grenadines | 0.0 /100 | #317 | Tragic 6.4% |
| British West Indians | 0.0 /100 | #318 | Tragic 6.4% |
| Immigrants | Bangladesh | 0.0 /100 | #319 | Tragic 6.5% |
| Immigrants | Dominica | 0.0 /100 | #320 | Tragic 6.5% |
| Blacks/African Americans | 0.0 /100 | #321 | Tragic 6.5% |
| Vietnamese | 0.0 /100 | #322 | Tragic 6.5% |
| Immigrants | Belize | 0.0 /100 | #323 | Tragic 6.5% |
| Cheyenne | 0.0 /100 | #324 | Tragic 6.6% |
| Apache | 0.0 /100 | #325 | Tragic 6.6% |
| Natives/Alaskans | 0.0 /100 | #326 | Tragic 6.6% |
| Alaska Natives | 0.0 /100 | #327 | Tragic 6.6% |
| Guyanese | 0.0 /100 | #328 | Tragic 6.7% |
| Immigrants | Guyana | 0.0 /100 | #329 | Tragic 6.7% |