Immigrants from Iraq vs German Russian Unemployment Among Ages 55 to 59 years
COMPARE
Immigrants from Iraq
German Russian
Unemployment Among Ages 55 to 59 years
Unemployment Among Ages 55 to 59 years Comparison
Immigrants from Iraq
German Russians
4.6%
UNEMPLOYMENT AMONG AGES 55 TO 59 YEARS
98.5/ 100
METRIC RATING
75th/ 347
METRIC RANK
4.5%
UNEMPLOYMENT AMONG AGES 55 TO 59 YEARS
99.8/ 100
METRIC RATING
47th/ 347
METRIC RANK
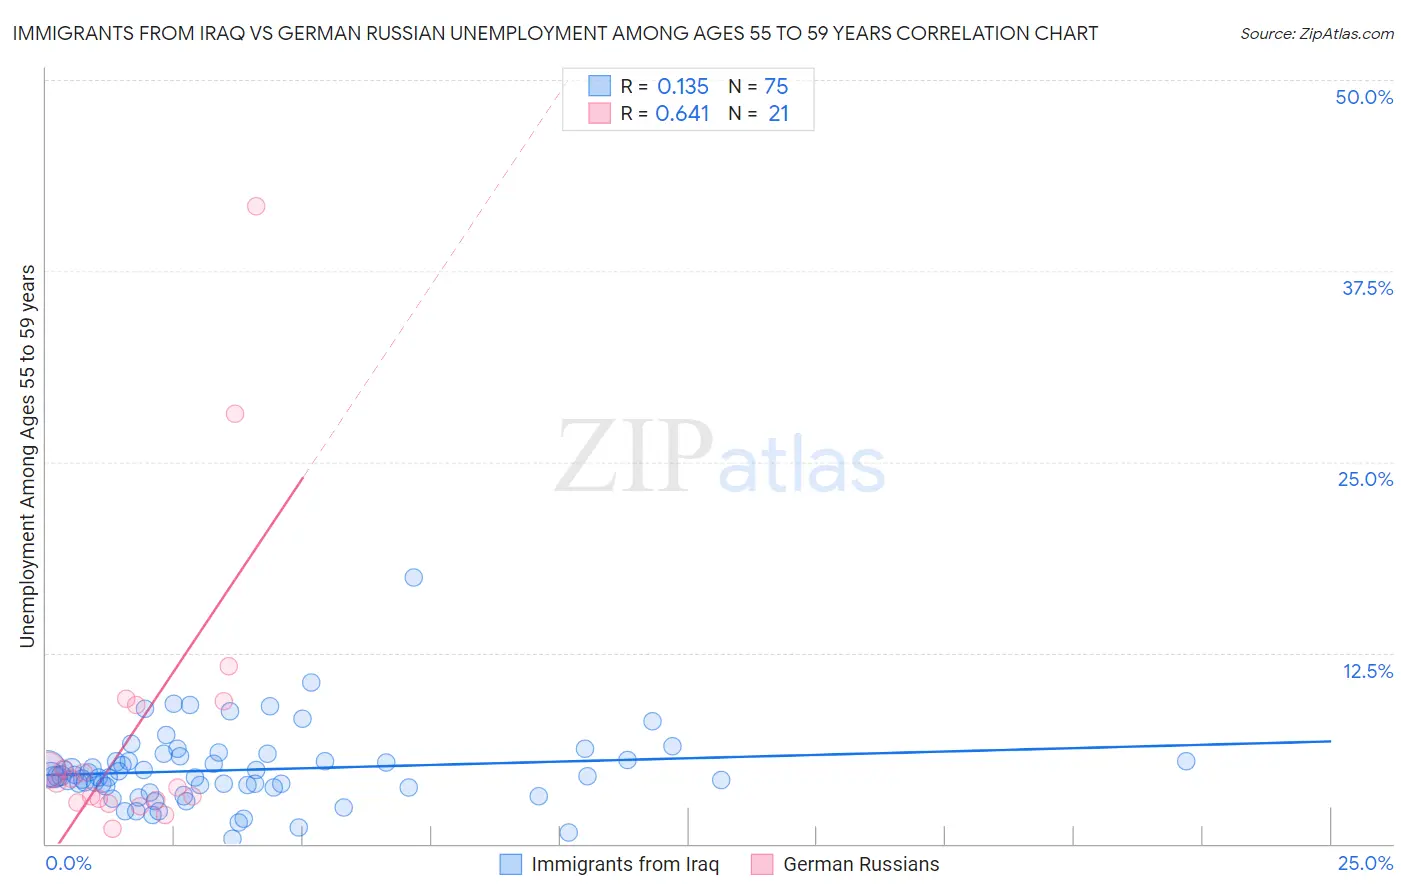
Immigrants from Iraq vs German Russian Unemployment Among Ages 55 to 59 years Correlation Chart
The statistical analysis conducted on geographies consisting of 189,094,455 people shows a poor positive correlation between the proportion of Immigrants from Iraq and unemployment rate among population between the ages 55 and 59 in the United States with a correlation coefficient (R) of 0.135 and weighted average of 4.6%. Similarly, the statistical analysis conducted on geographies consisting of 93,561,561 people shows a significant positive correlation between the proportion of German Russians and unemployment rate among population between the ages 55 and 59 in the United States with a correlation coefficient (R) of 0.641 and weighted average of 4.5%, a difference of 2.1%.
Unemployment Among Ages 55 to 59 years Correlation Summary
| Measurement | Immigrants from Iraq | German Russian |
| Minimum | 0.30% | 0.96% |
| Maximum | 17.4% | 41.7% |
| Range | 17.1% | 40.7% |
| Mean | 4.8% | 7.5% |
| Median | 4.4% | 4.0% |
| Interquartile 25% (IQ1) | 3.7% | 2.8% |
| Interquartile 75% (IQ3) | 5.5% | 9.2% |
| Interquartile Range (IQR) | 1.8% | 6.4% |
| Standard Deviation (Sample) | 2.5% | 9.8% |
| Standard Deviation (Population) | 2.5% | 9.5% |
Similar Demographics by Unemployment Among Ages 55 to 59 years
Demographics Similar to Immigrants from Iraq by Unemployment Among Ages 55 to 59 years
In terms of unemployment among ages 55 to 59 years, the demographic groups most similar to Immigrants from Iraq are Croatian (4.6%, a difference of 0.020%), Immigrants from Bosnia and Herzegovina (4.6%, a difference of 0.070%), Scotch-Irish (4.6%, a difference of 0.080%), Bhutanese (4.6%, a difference of 0.090%), and Finnish (4.6%, a difference of 0.13%).
| Demographics | Rating | Rank | Unemployment Among Ages 55 to 59 years |
| Immigrants | Micronesia | 99.0 /100 | #68 | Exceptional 4.6% |
| Czechoslovakians | 99.0 /100 | #69 | Exceptional 4.6% |
| Filipinos | 98.8 /100 | #70 | Exceptional 4.6% |
| Immigrants | Jordan | 98.7 /100 | #71 | Exceptional 4.6% |
| Immigrants | Taiwan | 98.7 /100 | #72 | Exceptional 4.6% |
| Bhutanese | 98.6 /100 | #73 | Exceptional 4.6% |
| Croatians | 98.5 /100 | #74 | Exceptional 4.6% |
| Immigrants | Iraq | 98.5 /100 | #75 | Exceptional 4.6% |
| Immigrants | Bosnia and Herzegovina | 98.3 /100 | #76 | Exceptional 4.6% |
| Scotch-Irish | 98.3 /100 | #77 | Exceptional 4.6% |
| Finns | 98.2 /100 | #78 | Exceptional 4.6% |
| Sri Lankans | 98.1 /100 | #79 | Exceptional 4.6% |
| Cambodians | 98.0 /100 | #80 | Exceptional 4.6% |
| Taiwanese | 97.9 /100 | #81 | Exceptional 4.6% |
| Latvians | 97.8 /100 | #82 | Exceptional 4.6% |
Demographics Similar to German Russians by Unemployment Among Ages 55 to 59 years
In terms of unemployment among ages 55 to 59 years, the demographic groups most similar to German Russians are Immigrants from Zaire (4.5%, a difference of 0.060%), British (4.5%, a difference of 0.080%), Immigrants from Korea (4.5%, a difference of 0.15%), European (4.5%, a difference of 0.15%), and Immigrants from Kuwait (4.5%, a difference of 0.19%).
| Demographics | Rating | Rank | Unemployment Among Ages 55 to 59 years |
| Swiss | 99.8 /100 | #40 | Exceptional 4.5% |
| Luxembourgers | 99.8 /100 | #41 | Exceptional 4.5% |
| Immigrants | Kuwait | 99.8 /100 | #42 | Exceptional 4.5% |
| Immigrants | Korea | 99.8 /100 | #43 | Exceptional 4.5% |
| Europeans | 99.8 /100 | #44 | Exceptional 4.5% |
| British | 99.8 /100 | #45 | Exceptional 4.5% |
| Immigrants | Zaire | 99.8 /100 | #46 | Exceptional 4.5% |
| German Russians | 99.8 /100 | #47 | Exceptional 4.5% |
| Immigrants | Moldova | 99.7 /100 | #48 | Exceptional 4.5% |
| Immigrants | Saudi Arabia | 99.7 /100 | #49 | Exceptional 4.5% |
| Immigrants | Pakistan | 99.7 /100 | #50 | Exceptional 4.5% |
| Maltese | 99.7 /100 | #51 | Exceptional 4.5% |
| Scottish | 99.7 /100 | #52 | Exceptional 4.5% |
| Immigrants | Middle Africa | 99.7 /100 | #53 | Exceptional 4.5% |
| Burmese | 99.7 /100 | #54 | Exceptional 4.5% |