Arapaho vs Kiowa Female Unemployment
COMPARE
Arapaho
Kiowa
Female Unemployment
Female Unemployment Comparison
Arapaho
Kiowa
8.8%
FEMALE UNEMPLOYMENT
0.0/ 100
METRIC RATING
343rd/ 347
METRIC RANK
5.8%
FEMALE UNEMPLOYMENT
0.1/ 100
METRIC RATING
261st/ 347
METRIC RANK
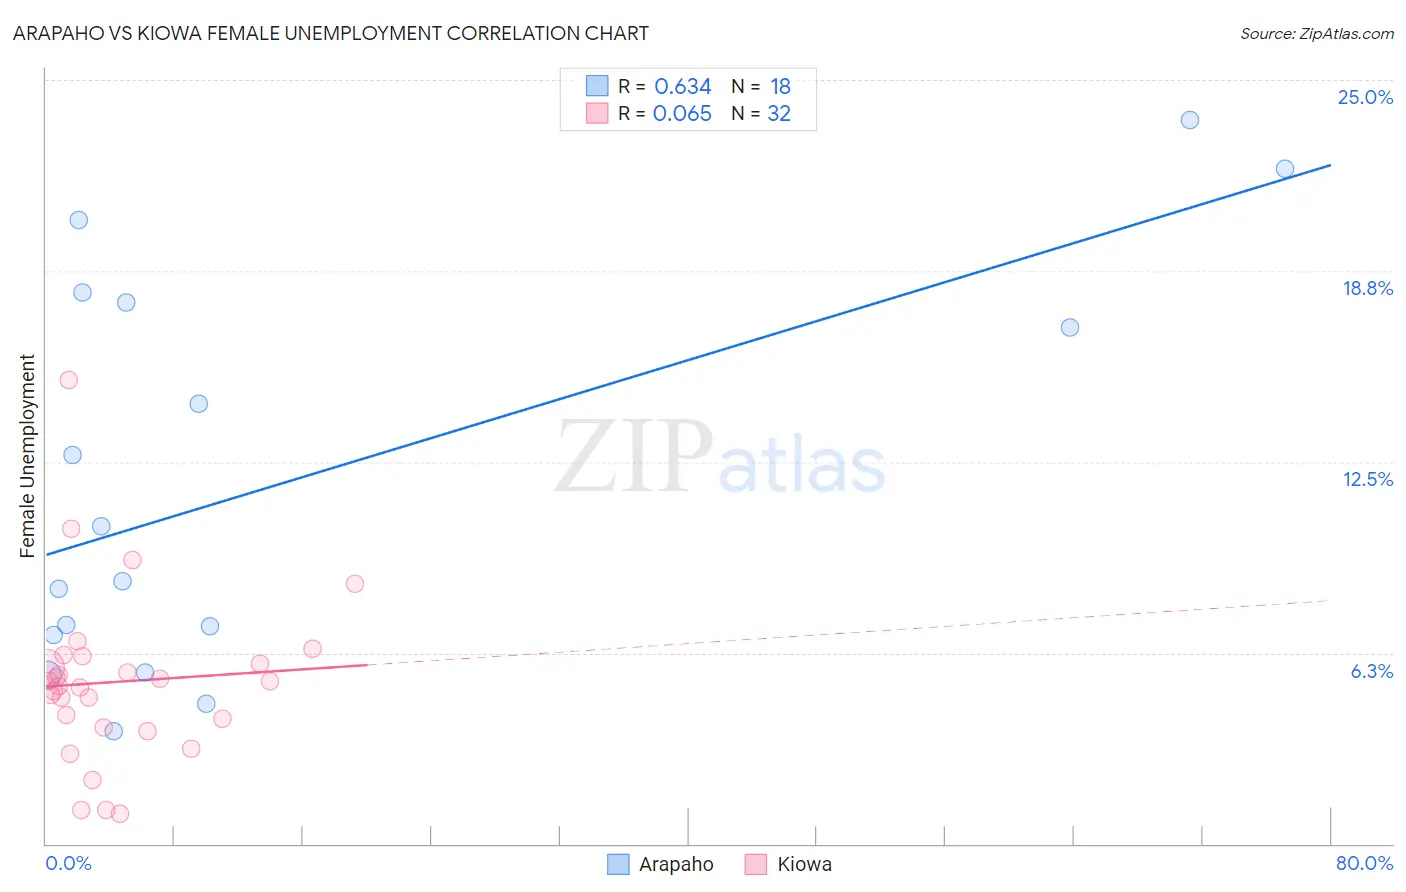
Arapaho vs Kiowa Female Unemployment Correlation Chart
The statistical analysis conducted on geographies consisting of 29,729,190 people shows a significant positive correlation between the proportion of Arapaho and unemploymnet rate among females in the United States with a correlation coefficient (R) of 0.634 and weighted average of 8.8%. Similarly, the statistical analysis conducted on geographies consisting of 55,997,054 people shows a slight positive correlation between the proportion of Kiowa and unemploymnet rate among females in the United States with a correlation coefficient (R) of 0.065 and weighted average of 5.8%, a difference of 52.2%.
Female Unemployment Correlation Summary
| Measurement | Arapaho | Kiowa |
| Minimum | 3.7% | 1.0% |
| Maximum | 23.7% | 15.2% |
| Range | 20.0% | 14.2% |
| Mean | 11.9% | 5.3% |
| Median | 9.5% | 5.2% |
| Interquartile 25% (IQ1) | 6.9% | 4.0% |
| Interquartile 75% (IQ3) | 17.7% | 6.0% |
| Interquartile Range (IQR) | 10.9% | 2.1% |
| Standard Deviation (Sample) | 6.5% | 2.8% |
| Standard Deviation (Population) | 6.3% | 2.7% |
Similar Demographics by Female Unemployment
Demographics Similar to Arapaho by Female Unemployment
In terms of female unemployment, the demographic groups most similar to Arapaho are Puerto Rican (8.3%, a difference of 5.4%), Pima (9.3%, a difference of 6.2%), Inupiat (8.2%, a difference of 7.7%), Hopi (8.1%, a difference of 8.6%), and Yuman (9.6%, a difference of 9.1%).
| Demographics | Rating | Rank | Female Unemployment |
| Menominee | 0.0 /100 | #333 | Tragic 7.0% |
| Immigrants | Armenia | 0.0 /100 | #334 | Tragic 7.1% |
| Dominicans | 0.0 /100 | #335 | Tragic 7.2% |
| Immigrants | Dominican Republic | 0.0 /100 | #336 | Tragic 7.2% |
| Navajo | 0.0 /100 | #337 | Tragic 7.3% |
| Tohono O'odham | 0.0 /100 | #338 | Tragic 7.7% |
| Immigrants | Yemen | 0.0 /100 | #339 | Tragic 7.8% |
| Hopi | 0.0 /100 | #340 | Tragic 8.1% |
| Inupiat | 0.0 /100 | #341 | Tragic 8.2% |
| Puerto Ricans | 0.0 /100 | #342 | Tragic 8.3% |
| Arapaho | 0.0 /100 | #343 | Tragic 8.8% |
| Pima | 0.0 /100 | #344 | Tragic 9.3% |
| Yuman | 0.0 /100 | #345 | Tragic 9.6% |
| Yup'ik | 0.0 /100 | #346 | Tragic 10.9% |
| Crow | 0.0 /100 | #347 | Tragic 12.1% |
Demographics Similar to Kiowa by Female Unemployment
In terms of female unemployment, the demographic groups most similar to Kiowa are Immigrants from Nigeria (5.8%, a difference of 0.030%), Nigerian (5.8%, a difference of 0.26%), Immigrants from Fiji (5.8%, a difference of 0.30%), Immigrants from Portugal (5.8%, a difference of 0.41%), and Immigrants from the Azores (5.8%, a difference of 0.71%).
| Demographics | Rating | Rank | Female Unemployment |
| Immigrants | Immigrants | 0.6 /100 | #254 | Tragic 5.7% |
| Immigrants | Cameroon | 0.6 /100 | #255 | Tragic 5.7% |
| Sub-Saharan Africans | 0.4 /100 | #256 | Tragic 5.7% |
| Dutch West Indians | 0.3 /100 | #257 | Tragic 5.7% |
| Immigrants | Portugal | 0.2 /100 | #258 | Tragic 5.8% |
| Immigrants | Fiji | 0.2 /100 | #259 | Tragic 5.8% |
| Nigerians | 0.2 /100 | #260 | Tragic 5.8% |
| Kiowa | 0.1 /100 | #261 | Tragic 5.8% |
| Immigrants | Nigeria | 0.1 /100 | #262 | Tragic 5.8% |
| Immigrants | Azores | 0.1 /100 | #263 | Tragic 5.8% |
| Immigrants | Bahamas | 0.1 /100 | #264 | Tragic 5.8% |
| Blackfeet | 0.0 /100 | #265 | Tragic 5.9% |
| Cape Verdeans | 0.0 /100 | #266 | Tragic 5.9% |
| Nepalese | 0.0 /100 | #267 | Tragic 5.9% |
| Hondurans | 0.0 /100 | #268 | Tragic 5.9% |