Immigrants from India vs Iroquois Unemployment Among Ages 25 to 29 years
COMPARE
Immigrants from India
Iroquois
Unemployment Among Ages 25 to 29 years
Unemployment Among Ages 25 to 29 years Comparison
Immigrants from India
Iroquois
5.7%
UNEMPLOYMENT AMONG AGES 25 TO 29 YEARS
100.0/ 100
METRIC RATING
7th/ 347
METRIC RANK
7.5%
UNEMPLOYMENT AMONG AGES 25 TO 29 YEARS
0.0/ 100
METRIC RATING
277th/ 347
METRIC RANK
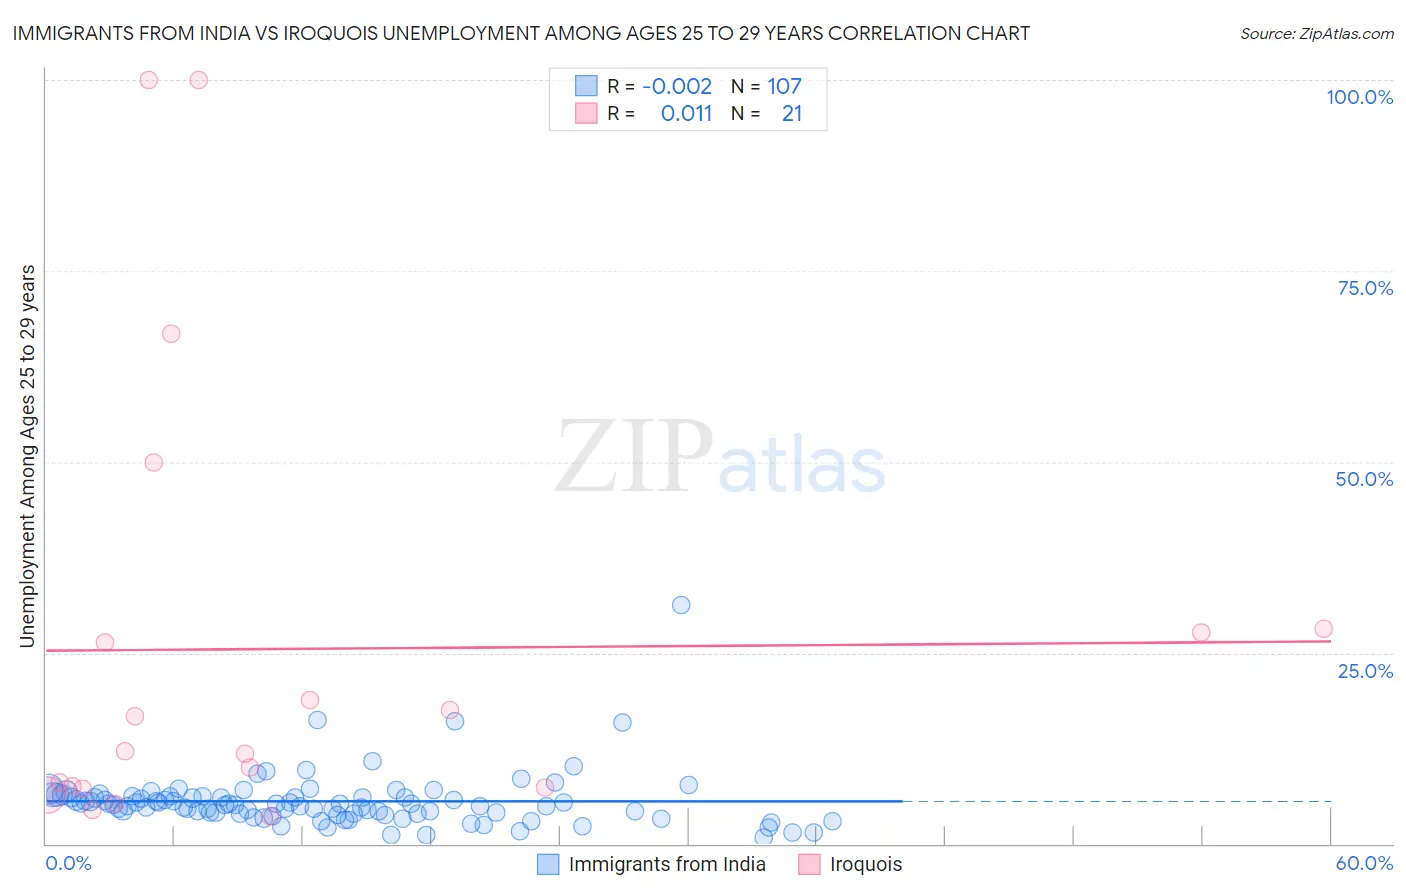
Immigrants from India vs Iroquois Unemployment Among Ages 25 to 29 years Correlation Chart
The statistical analysis conducted on geographies consisting of 410,894,390 people shows no correlation between the proportion of Immigrants from India and unemployment rate among population between the ages 25 and 29 in the United States with a correlation coefficient (R) of -0.002 and weighted average of 5.7%. Similarly, the statistical analysis conducted on geographies consisting of 200,181,681 people shows no correlation between the proportion of Iroquois and unemployment rate among population between the ages 25 and 29 in the United States with a correlation coefficient (R) of 0.011 and weighted average of 7.5%, a difference of 32.7%.
Unemployment Among Ages 25 to 29 years Correlation Summary
| Measurement | Immigrants from India | Iroquois |
| Minimum | 0.80% | 3.6% |
| Maximum | 31.3% | 100.0% |
| Range | 30.5% | 96.4% |
| Mean | 5.6% | 25.5% |
| Median | 5.1% | 12.1% |
| Interquartile 25% (IQ1) | 3.9% | 7.3% |
| Interquartile 75% (IQ3) | 6.2% | 27.9% |
| Interquartile Range (IQR) | 2.3% | 20.6% |
| Standard Deviation (Sample) | 3.6% | 29.3% |
| Standard Deviation (Population) | 3.6% | 28.6% |
Similar Demographics by Unemployment Among Ages 25 to 29 years
Demographics Similar to Immigrants from India by Unemployment Among Ages 25 to 29 years
In terms of unemployment among ages 25 to 29 years, the demographic groups most similar to Immigrants from India are Hmong (5.7%, a difference of 0.080%), Immigrants from Bosnia and Herzegovina (5.7%, a difference of 0.12%), Somali (5.6%, a difference of 0.27%), Immigrants from Cuba (5.6%, a difference of 0.34%), and Immigrants from Nepal (5.7%, a difference of 1.4%).
| Demographics | Rating | Rank | Unemployment Among Ages 25 to 29 years |
| Sudanese | 100.0 /100 | #1 | Exceptional 5.4% |
| Tongans | 100.0 /100 | #2 | Exceptional 5.5% |
| Immigrants | Somalia | 100.0 /100 | #3 | Exceptional 5.5% |
| Immigrants | Cuba | 100.0 /100 | #4 | Exceptional 5.6% |
| Somalis | 100.0 /100 | #5 | Exceptional 5.6% |
| Hmong | 100.0 /100 | #6 | Exceptional 5.7% |
| Immigrants | India | 100.0 /100 | #7 | Exceptional 5.7% |
| Immigrants | Bosnia and Herzegovina | 100.0 /100 | #8 | Exceptional 5.7% |
| Immigrants | Nepal | 100.0 /100 | #9 | Exceptional 5.7% |
| Immigrants | Sudan | 100.0 /100 | #10 | Exceptional 5.8% |
| Cambodians | 100.0 /100 | #11 | Exceptional 5.8% |
| Okinawans | 100.0 /100 | #12 | Exceptional 5.9% |
| Immigrants | Bolivia | 100.0 /100 | #13 | Exceptional 5.9% |
| Immigrants | Kuwait | 99.9 /100 | #14 | Exceptional 5.9% |
| Cubans | 99.9 /100 | #15 | Exceptional 5.9% |
Demographics Similar to Iroquois by Unemployment Among Ages 25 to 29 years
In terms of unemployment among ages 25 to 29 years, the demographic groups most similar to Iroquois are Mexican (7.5%, a difference of 0.040%), French American Indian (7.5%, a difference of 0.060%), Nepalese (7.5%, a difference of 0.17%), Immigrants from Caribbean (7.5%, a difference of 0.31%), and Immigrants from Ghana (7.5%, a difference of 0.40%).
| Demographics | Rating | Rank | Unemployment Among Ages 25 to 29 years |
| Bahamians | 0.0 /100 | #270 | Tragic 7.5% |
| Choctaw | 0.0 /100 | #271 | Tragic 7.5% |
| Immigrants | Bahamas | 0.0 /100 | #272 | Tragic 7.5% |
| Immigrants | Nigeria | 0.0 /100 | #273 | Tragic 7.5% |
| Immigrants | Central America | 0.0 /100 | #274 | Tragic 7.5% |
| Immigrants | Ghana | 0.0 /100 | #275 | Tragic 7.5% |
| French American Indians | 0.0 /100 | #276 | Tragic 7.5% |
| Iroquois | 0.0 /100 | #277 | Tragic 7.5% |
| Mexicans | 0.0 /100 | #278 | Tragic 7.5% |
| Nepalese | 0.0 /100 | #279 | Tragic 7.5% |
| Immigrants | Caribbean | 0.0 /100 | #280 | Tragic 7.5% |
| Immigrants | Bangladesh | 0.0 /100 | #281 | Tragic 7.5% |
| Immigrants | Senegal | 0.0 /100 | #282 | Tragic 7.6% |
| Creek | 0.0 /100 | #283 | Tragic 7.6% |
| Cherokee | 0.0 /100 | #284 | Tragic 7.6% |