Immigrants from Honduras vs Thai Unemployment Among Ages 35 to 44 years
COMPARE
Immigrants from Honduras
Thai
Unemployment Among Ages 35 to 44 years
Unemployment Among Ages 35 to 44 years Comparison
Immigrants from Honduras
Thais
5.1%
UNEMPLOYMENT AMONG AGES 35 TO 44 YEARS
0.6/ 100
METRIC RATING
241st/ 347
METRIC RANK
3.9%
UNEMPLOYMENT AMONG AGES 35 TO 44 YEARS
100.0/ 100
METRIC RATING
2nd/ 347
METRIC RANK
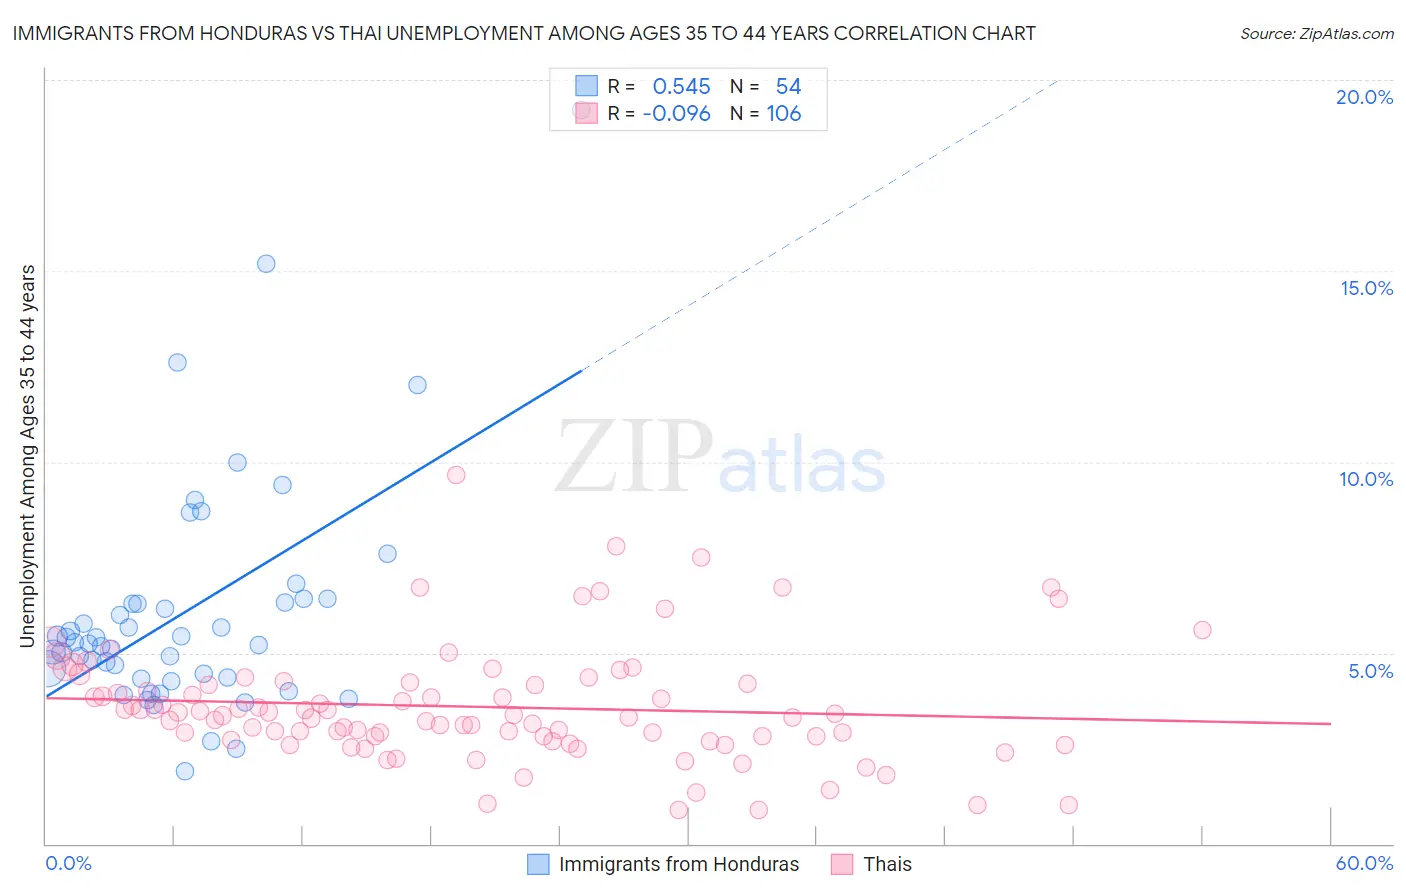
Immigrants from Honduras vs Thai Unemployment Among Ages 35 to 44 years Correlation Chart
The statistical analysis conducted on geographies consisting of 317,592,724 people shows a substantial positive correlation between the proportion of Immigrants from Honduras and unemployment rate among population between the ages 35 and 44 in the United States with a correlation coefficient (R) of 0.545 and weighted average of 5.1%. Similarly, the statistical analysis conducted on geographies consisting of 461,302,487 people shows a slight negative correlation between the proportion of Thais and unemployment rate among population between the ages 35 and 44 in the United States with a correlation coefficient (R) of -0.096 and weighted average of 3.9%, a difference of 29.8%.
Unemployment Among Ages 35 to 44 years Correlation Summary
| Measurement | Immigrants from Honduras | Thai |
| Minimum | 1.9% | 0.90% |
| Maximum | 19.2% | 9.7% |
| Range | 17.3% | 8.8% |
| Mean | 6.1% | 3.6% |
| Median | 5.3% | 3.4% |
| Interquartile 25% (IQ1) | 4.4% | 2.8% |
| Interquartile 75% (IQ3) | 6.3% | 4.2% |
| Interquartile Range (IQR) | 1.9% | 1.4% |
| Standard Deviation (Sample) | 3.1% | 1.5% |
| Standard Deviation (Population) | 3.0% | 1.5% |
Similar Demographics by Unemployment Among Ages 35 to 44 years
Demographics Similar to Immigrants from Honduras by Unemployment Among Ages 35 to 44 years
In terms of unemployment among ages 35 to 44 years, the demographic groups most similar to Immigrants from Honduras are Somali (5.1%, a difference of 0.18%), Nigerian (5.1%, a difference of 0.31%), Honduran (5.1%, a difference of 0.37%), Delaware (5.1%, a difference of 0.37%), and Salvadoran (5.1%, a difference of 0.49%).
| Demographics | Rating | Rank | Unemployment Among Ages 35 to 44 years |
| Portuguese | 1.1 /100 | #234 | Tragic 5.1% |
| Guamanians/Chamorros | 0.9 /100 | #235 | Tragic 5.1% |
| Central Americans | 0.8 /100 | #236 | Tragic 5.1% |
| Kiowa | 0.8 /100 | #237 | Tragic 5.1% |
| Hondurans | 0.7 /100 | #238 | Tragic 5.1% |
| Nigerians | 0.7 /100 | #239 | Tragic 5.1% |
| Somalis | 0.7 /100 | #240 | Tragic 5.1% |
| Immigrants | Honduras | 0.6 /100 | #241 | Tragic 5.1% |
| Delaware | 0.5 /100 | #242 | Tragic 5.1% |
| Salvadorans | 0.4 /100 | #243 | Tragic 5.1% |
| Guatemalans | 0.4 /100 | #244 | Tragic 5.1% |
| Bahamians | 0.4 /100 | #245 | Tragic 5.2% |
| Immigrants | Guatemala | 0.4 /100 | #246 | Tragic 5.2% |
| Immigrants | Somalia | 0.3 /100 | #247 | Tragic 5.2% |
| Alsatians | 0.2 /100 | #248 | Tragic 5.2% |
Demographics Similar to Thais by Unemployment Among Ages 35 to 44 years
In terms of unemployment among ages 35 to 44 years, the demographic groups most similar to Thais are Norwegian (4.0%, a difference of 1.4%), Immigrants from Taiwan (4.0%, a difference of 1.9%), Filipino (4.0%, a difference of 2.6%), Immigrants from Venezuela (4.0%, a difference of 2.7%), and Immigrants from Cuba (4.1%, a difference of 3.5%).
| Demographics | Rating | Rank | Unemployment Among Ages 35 to 44 years |
| Immigrants | India | 100.0 /100 | #1 | Exceptional 3.8% |
| Thais | 100.0 /100 | #2 | Exceptional 3.9% |
| Norwegians | 100.0 /100 | #3 | Exceptional 4.0% |
| Immigrants | Taiwan | 100.0 /100 | #4 | Exceptional 4.0% |
| Filipinos | 100.0 /100 | #5 | Exceptional 4.0% |
| Immigrants | Venezuela | 100.0 /100 | #6 | Exceptional 4.0% |
| Immigrants | Cuba | 99.9 /100 | #7 | Exceptional 4.1% |
| Immigrants | South Central Asia | 99.9 /100 | #8 | Exceptional 4.1% |
| Danes | 99.9 /100 | #9 | Exceptional 4.1% |
| Immigrants | Singapore | 99.9 /100 | #10 | Exceptional 4.1% |
| Sudanese | 99.9 /100 | #11 | Exceptional 4.1% |
| Venezuelans | 99.9 /100 | #12 | Exceptional 4.1% |
| Bolivians | 99.9 /100 | #13 | Exceptional 4.1% |
| Czechs | 99.9 /100 | #14 | Exceptional 4.1% |
| Tongans | 99.8 /100 | #15 | Exceptional 4.2% |