Immigrants from Honduras vs Immigrants from Barbados Unemployment Among Ages 35 to 44 years
COMPARE
Immigrants from Honduras
Immigrants from Barbados
Unemployment Among Ages 35 to 44 years
Unemployment Among Ages 35 to 44 years Comparison
Immigrants from Honduras
Immigrants from Barbados
5.1%
UNEMPLOYMENT AMONG AGES 35 TO 44 YEARS
0.6/ 100
METRIC RATING
241st/ 347
METRIC RANK
5.8%
UNEMPLOYMENT AMONG AGES 35 TO 44 YEARS
0.0/ 100
METRIC RATING
309th/ 347
METRIC RANK
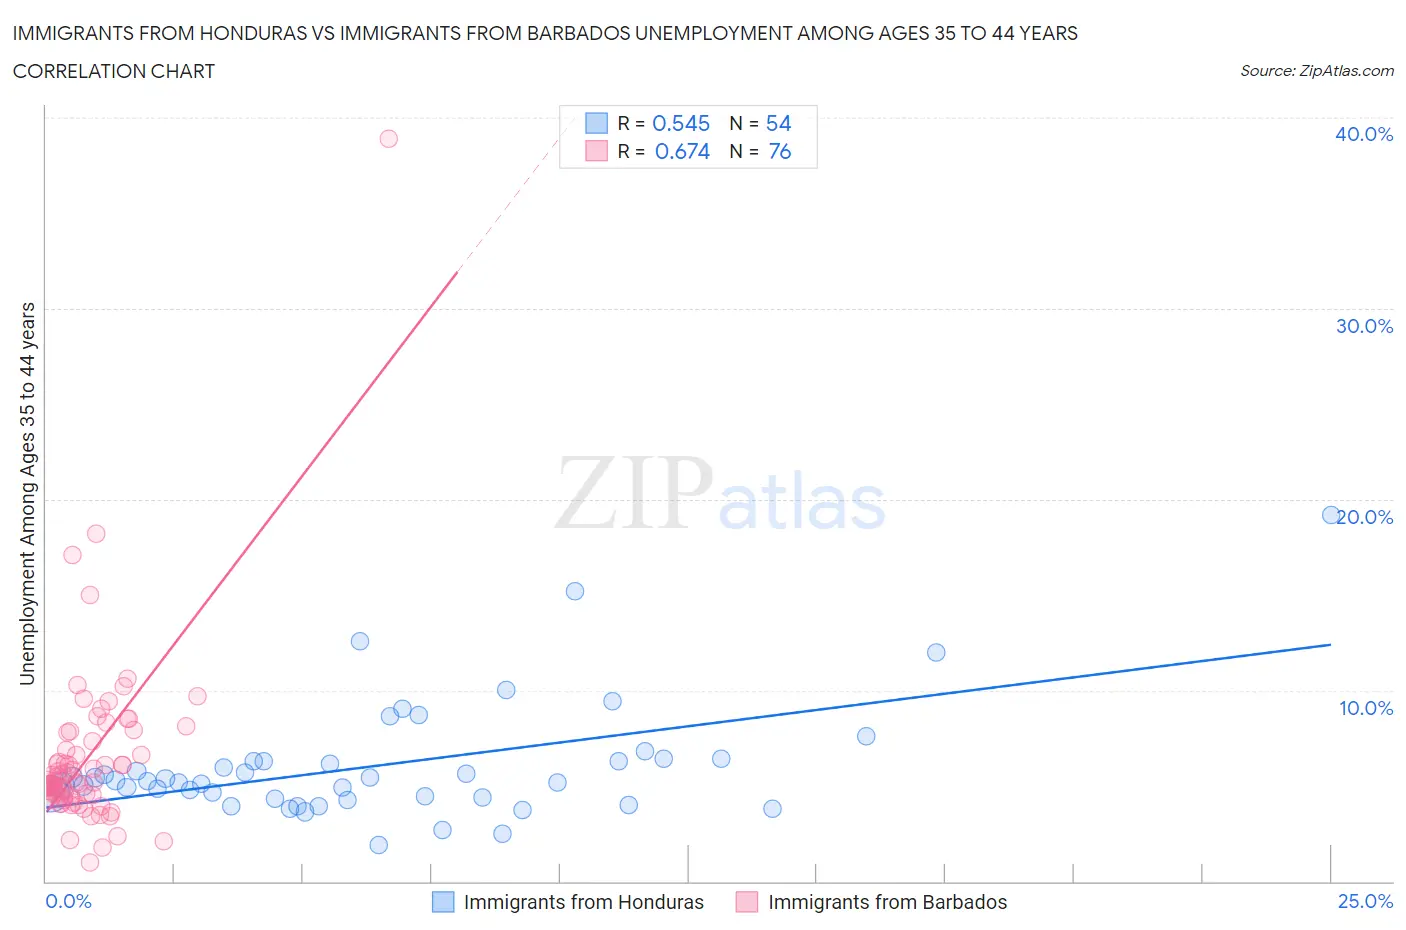
Immigrants from Honduras vs Immigrants from Barbados Unemployment Among Ages 35 to 44 years Correlation Chart
The statistical analysis conducted on geographies consisting of 317,592,724 people shows a substantial positive correlation between the proportion of Immigrants from Honduras and unemployment rate among population between the ages 35 and 44 in the United States with a correlation coefficient (R) of 0.545 and weighted average of 5.1%. Similarly, the statistical analysis conducted on geographies consisting of 112,406,492 people shows a significant positive correlation between the proportion of Immigrants from Barbados and unemployment rate among population between the ages 35 and 44 in the United States with a correlation coefficient (R) of 0.674 and weighted average of 5.8%, a difference of 13.2%.
Unemployment Among Ages 35 to 44 years Correlation Summary
| Measurement | Immigrants from Honduras | Immigrants from Barbados |
| Minimum | 1.9% | 1.0% |
| Maximum | 19.2% | 38.9% |
| Range | 17.3% | 37.9% |
| Mean | 6.1% | 6.5% |
| Median | 5.3% | 5.2% |
| Interquartile 25% (IQ1) | 4.4% | 4.4% |
| Interquartile 75% (IQ3) | 6.3% | 7.6% |
| Interquartile Range (IQR) | 1.9% | 3.2% |
| Standard Deviation (Sample) | 3.1% | 4.8% |
| Standard Deviation (Population) | 3.0% | 4.8% |
Similar Demographics by Unemployment Among Ages 35 to 44 years
Demographics Similar to Immigrants from Honduras by Unemployment Among Ages 35 to 44 years
In terms of unemployment among ages 35 to 44 years, the demographic groups most similar to Immigrants from Honduras are Somali (5.1%, a difference of 0.18%), Nigerian (5.1%, a difference of 0.31%), Honduran (5.1%, a difference of 0.37%), Delaware (5.1%, a difference of 0.37%), and Salvadoran (5.1%, a difference of 0.49%).
| Demographics | Rating | Rank | Unemployment Among Ages 35 to 44 years |
| Portuguese | 1.1 /100 | #234 | Tragic 5.1% |
| Guamanians/Chamorros | 0.9 /100 | #235 | Tragic 5.1% |
| Central Americans | 0.8 /100 | #236 | Tragic 5.1% |
| Kiowa | 0.8 /100 | #237 | Tragic 5.1% |
| Hondurans | 0.7 /100 | #238 | Tragic 5.1% |
| Nigerians | 0.7 /100 | #239 | Tragic 5.1% |
| Somalis | 0.7 /100 | #240 | Tragic 5.1% |
| Immigrants | Honduras | 0.6 /100 | #241 | Tragic 5.1% |
| Delaware | 0.5 /100 | #242 | Tragic 5.1% |
| Salvadorans | 0.4 /100 | #243 | Tragic 5.1% |
| Guatemalans | 0.4 /100 | #244 | Tragic 5.1% |
| Bahamians | 0.4 /100 | #245 | Tragic 5.2% |
| Immigrants | Guatemala | 0.4 /100 | #246 | Tragic 5.2% |
| Immigrants | Somalia | 0.3 /100 | #247 | Tragic 5.2% |
| Alsatians | 0.2 /100 | #248 | Tragic 5.2% |
Demographics Similar to Immigrants from Barbados by Unemployment Among Ages 35 to 44 years
In terms of unemployment among ages 35 to 44 years, the demographic groups most similar to Immigrants from Barbados are Immigrants from the Azores (5.8%, a difference of 0.29%), Immigrants from Belize (5.8%, a difference of 0.57%), Barbadian (5.7%, a difference of 1.1%), Guyanese (5.9%, a difference of 1.7%), and Marshallese (5.9%, a difference of 1.9%).
| Demographics | Rating | Rank | Unemployment Among Ages 35 to 44 years |
| Nepalese | 0.0 /100 | #302 | Tragic 5.6% |
| Yakama | 0.0 /100 | #303 | Tragic 5.6% |
| West Indians | 0.0 /100 | #304 | Tragic 5.7% |
| Belizeans | 0.0 /100 | #305 | Tragic 5.7% |
| Barbadians | 0.0 /100 | #306 | Tragic 5.7% |
| Immigrants | Belize | 0.0 /100 | #307 | Tragic 5.8% |
| Immigrants | Azores | 0.0 /100 | #308 | Tragic 5.8% |
| Immigrants | Barbados | 0.0 /100 | #309 | Tragic 5.8% |
| Guyanese | 0.0 /100 | #310 | Tragic 5.9% |
| Marshallese | 0.0 /100 | #311 | Tragic 5.9% |
| Immigrants | Guyana | 0.0 /100 | #312 | Tragic 6.0% |
| British West Indians | 0.0 /100 | #313 | Tragic 6.0% |
| Immigrants | Dominica | 0.0 /100 | #314 | Tragic 6.0% |
| Blacks/African Americans | 0.0 /100 | #315 | Tragic 6.1% |
| Tsimshian | 0.0 /100 | #316 | Tragic 6.2% |