Dominican vs Thai Unemployment Among Ages 35 to 44 years
COMPARE
Dominican
Thai
Unemployment Among Ages 35 to 44 years
Unemployment Among Ages 35 to 44 years Comparison
Dominicans
Thais
6.4%
UNEMPLOYMENT AMONG AGES 35 TO 44 YEARS
0.0/ 100
METRIC RATING
323rd/ 347
METRIC RANK
3.9%
UNEMPLOYMENT AMONG AGES 35 TO 44 YEARS
100.0/ 100
METRIC RATING
2nd/ 347
METRIC RANK
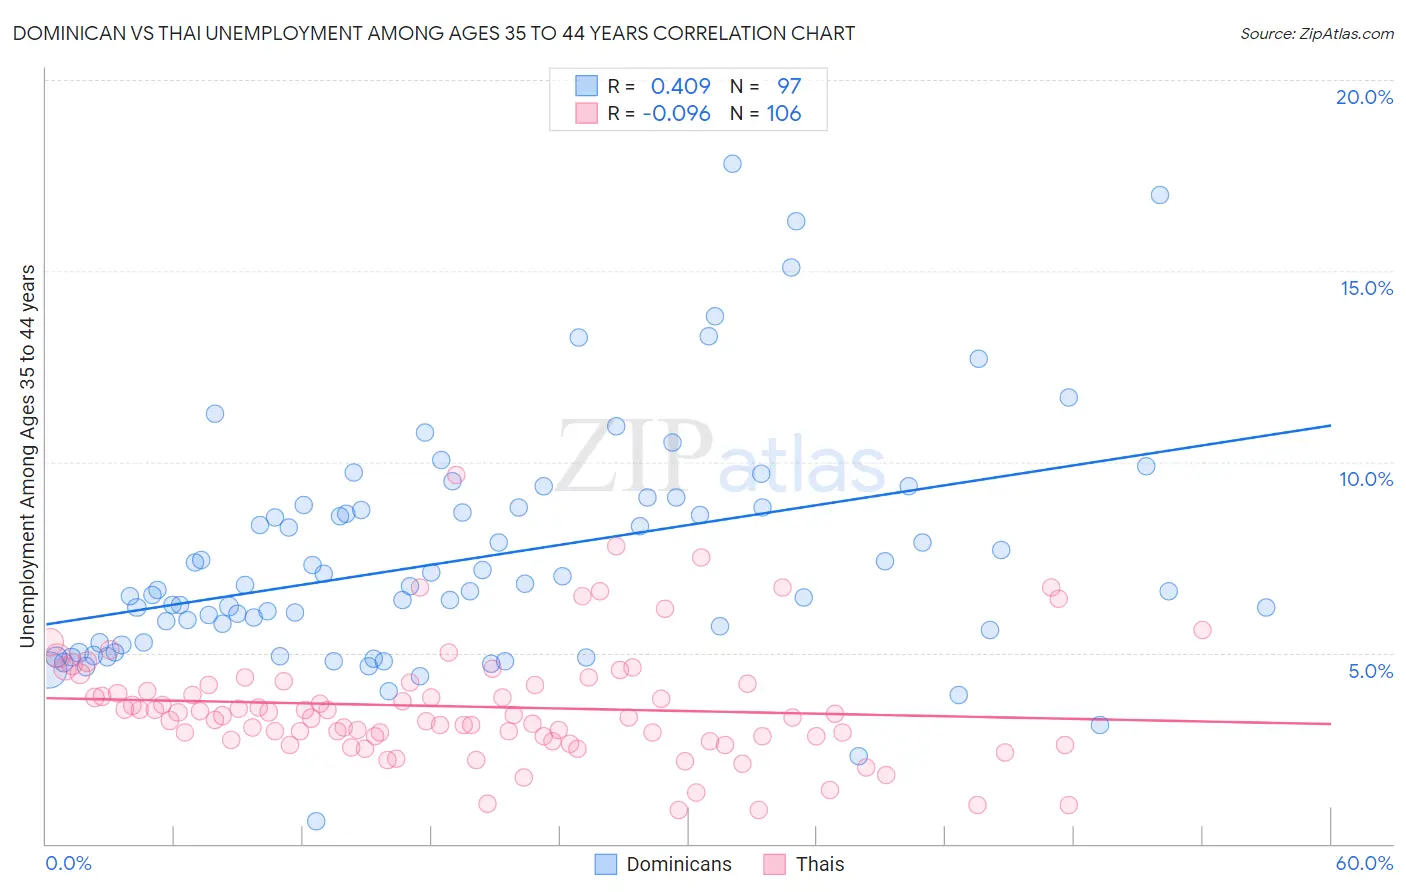
Dominican vs Thai Unemployment Among Ages 35 to 44 years Correlation Chart
The statistical analysis conducted on geographies consisting of 348,071,725 people shows a moderate positive correlation between the proportion of Dominicans and unemployment rate among population between the ages 35 and 44 in the United States with a correlation coefficient (R) of 0.409 and weighted average of 6.4%. Similarly, the statistical analysis conducted on geographies consisting of 461,302,487 people shows a slight negative correlation between the proportion of Thais and unemployment rate among population between the ages 35 and 44 in the United States with a correlation coefficient (R) of -0.096 and weighted average of 3.9%, a difference of 63.1%.
Unemployment Among Ages 35 to 44 years Correlation Summary
| Measurement | Dominican | Thai |
| Minimum | 0.60% | 0.90% |
| Maximum | 17.8% | 9.7% |
| Range | 17.2% | 8.8% |
| Mean | 7.5% | 3.6% |
| Median | 6.7% | 3.4% |
| Interquartile 25% (IQ1) | 5.2% | 2.8% |
| Interquartile 75% (IQ3) | 8.8% | 4.2% |
| Interquartile Range (IQR) | 3.6% | 1.4% |
| Standard Deviation (Sample) | 3.0% | 1.5% |
| Standard Deviation (Population) | 3.0% | 1.5% |
Similar Demographics by Unemployment Among Ages 35 to 44 years
Demographics Similar to Dominicans by Unemployment Among Ages 35 to 44 years
In terms of unemployment among ages 35 to 44 years, the demographic groups most similar to Dominicans are Immigrants from Dominican Republic (6.4%, a difference of 0.080%), Menominee (6.5%, a difference of 1.6%), Immigrants from Yemen (6.6%, a difference of 1.9%), Alaska Native (6.6%, a difference of 2.0%), and Cape Verdean (6.6%, a difference of 2.1%).
| Demographics | Rating | Rank | Unemployment Among Ages 35 to 44 years |
| Tsimshian | 0.0 /100 | #316 | Tragic 6.2% |
| Immigrants | St. Vincent and the Grenadines | 0.0 /100 | #317 | Tragic 6.2% |
| Colville | 0.0 /100 | #318 | Tragic 6.2% |
| Immigrants | Grenada | 0.0 /100 | #319 | Tragic 6.2% |
| Immigrants | Armenia | 0.0 /100 | #320 | Tragic 6.2% |
| Chippewa | 0.0 /100 | #321 | Tragic 6.2% |
| Immigrants | Dominican Republic | 0.0 /100 | #322 | Tragic 6.4% |
| Dominicans | 0.0 /100 | #323 | Tragic 6.4% |
| Menominee | 0.0 /100 | #324 | Tragic 6.5% |
| Immigrants | Yemen | 0.0 /100 | #325 | Tragic 6.6% |
| Alaska Natives | 0.0 /100 | #326 | Tragic 6.6% |
| Cape Verdeans | 0.0 /100 | #327 | Tragic 6.6% |
| Shoshone | 0.0 /100 | #328 | Tragic 6.6% |
| Paiute | 0.0 /100 | #329 | Tragic 6.9% |
| Immigrants | Cabo Verde | 0.0 /100 | #330 | Tragic 6.9% |
Demographics Similar to Thais by Unemployment Among Ages 35 to 44 years
In terms of unemployment among ages 35 to 44 years, the demographic groups most similar to Thais are Norwegian (4.0%, a difference of 1.4%), Immigrants from Taiwan (4.0%, a difference of 1.9%), Filipino (4.0%, a difference of 2.6%), Immigrants from Venezuela (4.0%, a difference of 2.7%), and Immigrants from Cuba (4.1%, a difference of 3.5%).
| Demographics | Rating | Rank | Unemployment Among Ages 35 to 44 years |
| Immigrants | India | 100.0 /100 | #1 | Exceptional 3.8% |
| Thais | 100.0 /100 | #2 | Exceptional 3.9% |
| Norwegians | 100.0 /100 | #3 | Exceptional 4.0% |
| Immigrants | Taiwan | 100.0 /100 | #4 | Exceptional 4.0% |
| Filipinos | 100.0 /100 | #5 | Exceptional 4.0% |
| Immigrants | Venezuela | 100.0 /100 | #6 | Exceptional 4.0% |
| Immigrants | Cuba | 99.9 /100 | #7 | Exceptional 4.1% |
| Immigrants | South Central Asia | 99.9 /100 | #8 | Exceptional 4.1% |
| Danes | 99.9 /100 | #9 | Exceptional 4.1% |
| Immigrants | Singapore | 99.9 /100 | #10 | Exceptional 4.1% |
| Sudanese | 99.9 /100 | #11 | Exceptional 4.1% |
| Venezuelans | 99.9 /100 | #12 | Exceptional 4.1% |
| Bolivians | 99.9 /100 | #13 | Exceptional 4.1% |
| Czechs | 99.9 /100 | #14 | Exceptional 4.1% |
| Tongans | 99.8 /100 | #15 | Exceptional 4.2% |