Brazilian vs Canadian Unemployment Among Youth under 25 years
COMPARE
Brazilian
Canadian
Unemployment Among Youth under 25 years
Unemployment Among Youth under 25 years Comparison
Brazilians
Canadians
11.5%
UNEMPLOYMENT AMONG YOUTH UNDER 25 YEARS
72.5/ 100
METRIC RATING
146th/ 347
METRIC RANK
11.4%
UNEMPLOYMENT AMONG YOUTH UNDER 25 YEARS
86.6/ 100
METRIC RATING
126th/ 347
METRIC RANK
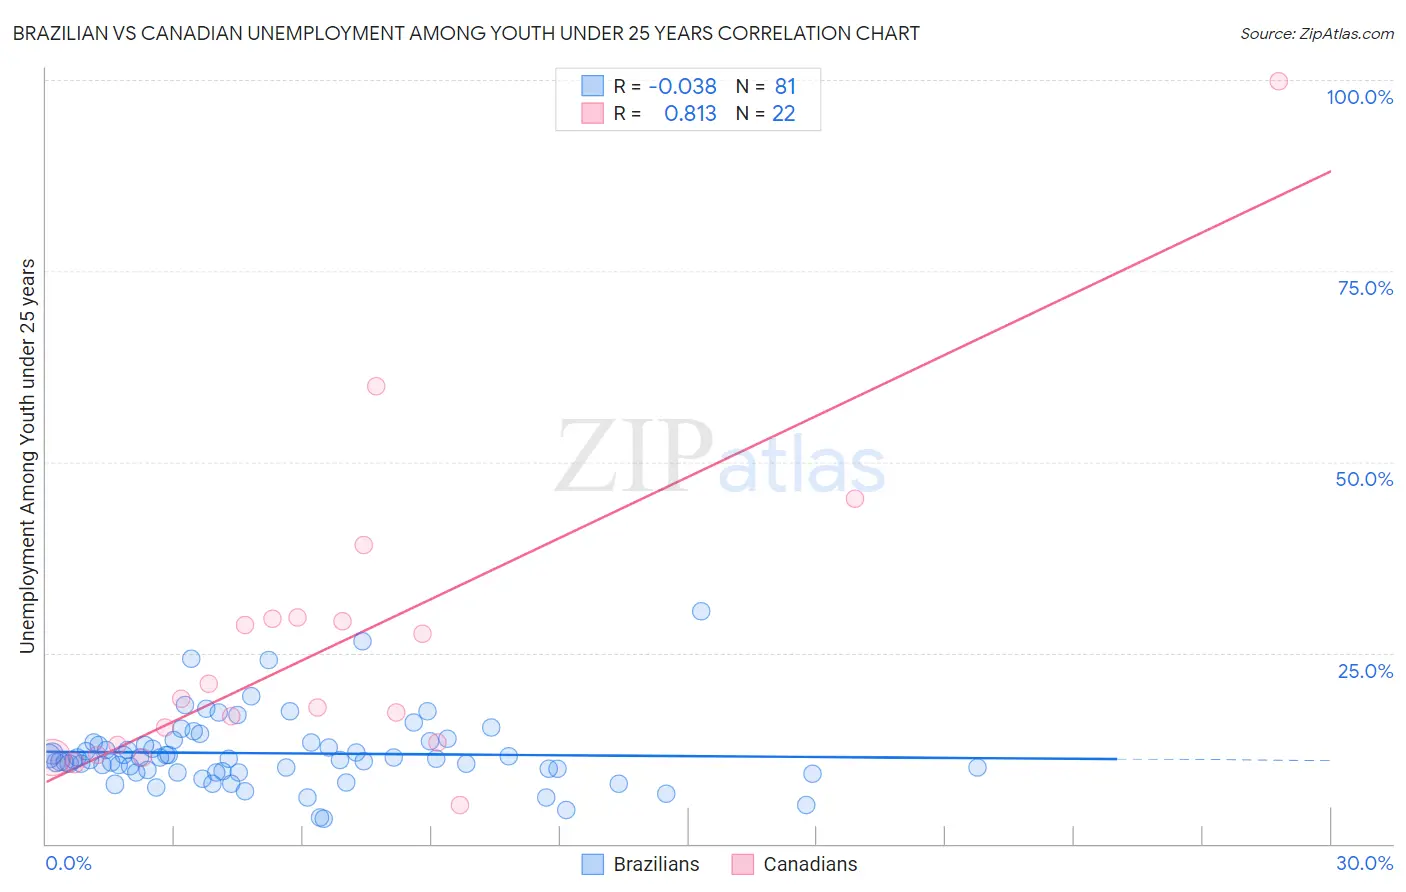
Brazilian vs Canadian Unemployment Among Youth under 25 years Correlation Chart
The statistical analysis conducted on geographies consisting of 321,254,906 people shows no correlation between the proportion of Brazilians and unemployment rate among youth under the age of 25 in the United States with a correlation coefficient (R) of -0.038 and weighted average of 11.5%. Similarly, the statistical analysis conducted on geographies consisting of 429,272,443 people shows a very strong positive correlation between the proportion of Canadians and unemployment rate among youth under the age of 25 in the United States with a correlation coefficient (R) of 0.813 and weighted average of 11.4%, a difference of 0.94%.
Unemployment Among Youth under 25 years Correlation Summary
| Measurement | Brazilian | Canadian |
| Minimum | 3.2% | 5.0% |
| Maximum | 30.5% | 99.9% |
| Range | 27.3% | 94.9% |
| Mean | 11.8% | 26.0% |
| Median | 11.1% | 18.4% |
| Interquartile 25% (IQ1) | 9.5% | 13.0% |
| Interquartile 75% (IQ3) | 13.3% | 29.4% |
| Interquartile Range (IQR) | 3.8% | 16.5% |
| Standard Deviation (Sample) | 4.7% | 21.0% |
| Standard Deviation (Population) | 4.6% | 20.5% |
Demographics Similar to Brazilians and Canadians by Unemployment Among Youth under 25 years
In terms of unemployment among youth under 25 years, the demographic groups most similar to Brazilians are Argentinean (11.5%, a difference of 0.020%), Immigrants from Brazil (11.5%, a difference of 0.090%), Immigrants from Uganda (11.5%, a difference of 0.10%), Immigrants from Korea (11.5%, a difference of 0.14%), and Immigrants from Uruguay (11.5%, a difference of 0.20%). Similarly, the demographic groups most similar to Canadians are Greek (11.4%, a difference of 0.040%), Immigrants from Hungary (11.4%, a difference of 0.050%), Turkish (11.4%, a difference of 0.070%), Hungarian (11.4%, a difference of 0.080%), and Immigrants from Spain (11.4%, a difference of 0.17%).
| Demographics | Rating | Rank | Unemployment Among Youth under 25 years |
| Canadians | 86.6 /100 | #126 | Excellent 11.4% |
| Greeks | 86.2 /100 | #127 | Excellent 11.4% |
| Immigrants | Hungary | 86.0 /100 | #128 | Excellent 11.4% |
| Turks | 85.8 /100 | #129 | Excellent 11.4% |
| Hungarians | 85.7 /100 | #130 | Excellent 11.4% |
| Immigrants | Spain | 84.6 /100 | #131 | Excellent 11.4% |
| Ethiopians | 83.2 /100 | #132 | Excellent 11.4% |
| Lebanese | 83.1 /100 | #133 | Excellent 11.4% |
| Immigrants | Chile | 80.4 /100 | #134 | Excellent 11.4% |
| Immigrants | Oceania | 80.2 /100 | #135 | Excellent 11.4% |
| Romanians | 80.1 /100 | #136 | Excellent 11.4% |
| Asians | 79.7 /100 | #137 | Good 11.4% |
| Immigrants | England | 78.1 /100 | #138 | Good 11.5% |
| Immigrants | Indonesia | 77.6 /100 | #139 | Good 11.5% |
| Immigrants | Belgium | 77.5 /100 | #140 | Good 11.5% |
| Immigrants | Uruguay | 76.1 /100 | #141 | Good 11.5% |
| Immigrants | Korea | 75.1 /100 | #142 | Good 11.5% |
| Immigrants | Uganda | 74.5 /100 | #143 | Good 11.5% |
| Immigrants | Brazil | 74.3 /100 | #144 | Good 11.5% |
| Argentineans | 73.0 /100 | #145 | Good 11.5% |
| Brazilians | 72.5 /100 | #146 | Good 11.5% |