Immigrants from Eastern Europe vs Canadian Unemployment Among Youth under 25 years
COMPARE
Immigrants from Eastern Europe
Canadian
Unemployment Among Youth under 25 years
Unemployment Among Youth under 25 years Comparison
Immigrants from Eastern Europe
Canadians
11.7%
UNEMPLOYMENT AMONG YOUTH UNDER 25 YEARS
34.1/ 100
METRIC RATING
184th/ 347
METRIC RANK
11.4%
UNEMPLOYMENT AMONG YOUTH UNDER 25 YEARS
86.6/ 100
METRIC RATING
126th/ 347
METRIC RANK
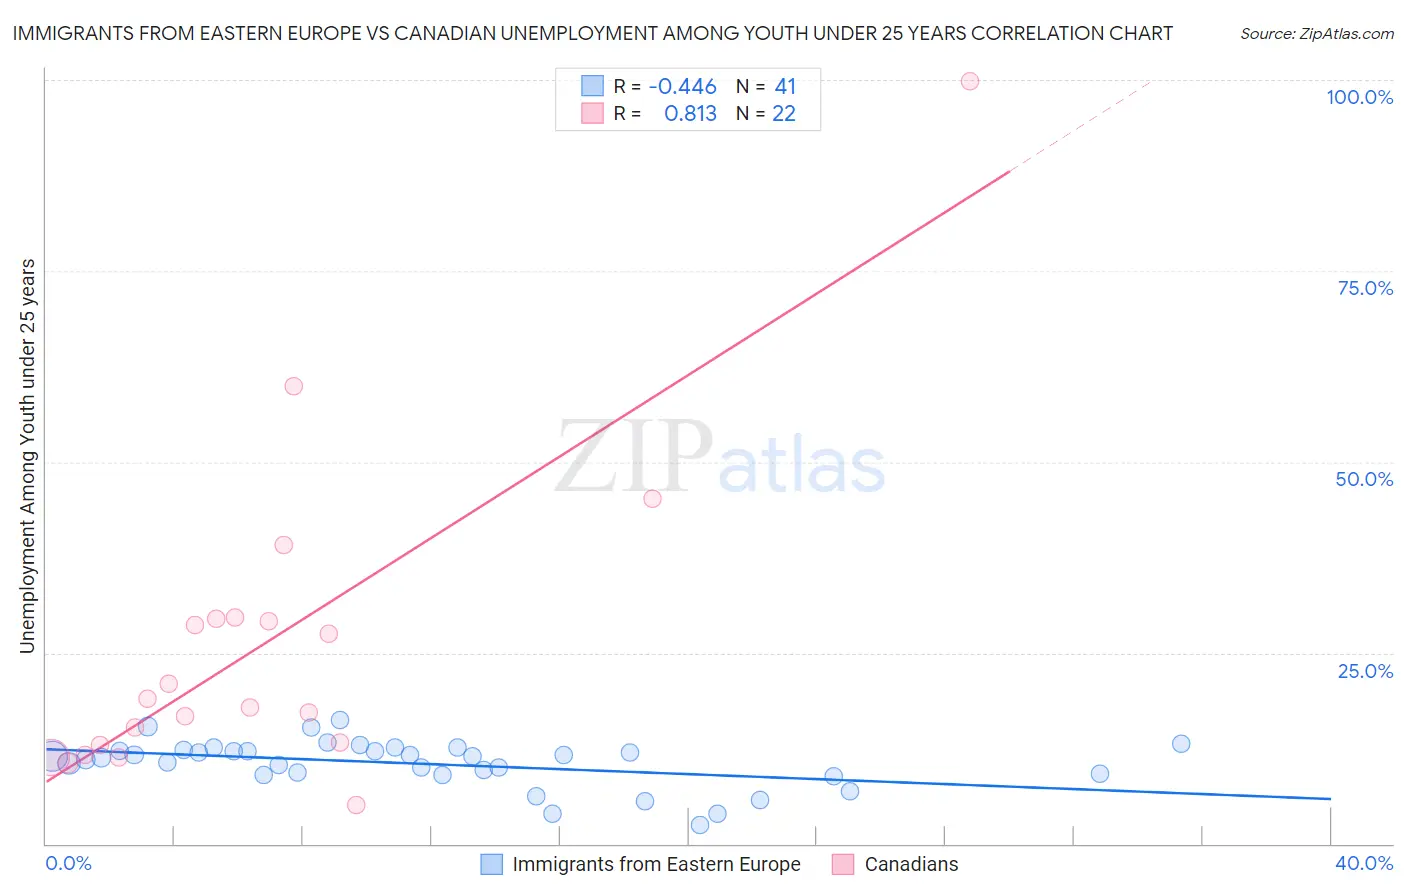
Immigrants from Eastern Europe vs Canadian Unemployment Among Youth under 25 years Correlation Chart
The statistical analysis conducted on geographies consisting of 466,316,471 people shows a moderate negative correlation between the proportion of Immigrants from Eastern Europe and unemployment rate among youth under the age of 25 in the United States with a correlation coefficient (R) of -0.446 and weighted average of 11.7%. Similarly, the statistical analysis conducted on geographies consisting of 429,272,443 people shows a very strong positive correlation between the proportion of Canadians and unemployment rate among youth under the age of 25 in the United States with a correlation coefficient (R) of 0.813 and weighted average of 11.4%, a difference of 2.6%.
Unemployment Among Youth under 25 years Correlation Summary
| Measurement | Immigrants from Eastern Europe | Canadian |
| Minimum | 2.4% | 5.0% |
| Maximum | 16.3% | 99.9% |
| Range | 13.9% | 94.9% |
| Mean | 10.5% | 26.0% |
| Median | 11.5% | 18.4% |
| Interquartile 25% (IQ1) | 9.0% | 13.0% |
| Interquartile 75% (IQ3) | 12.2% | 29.4% |
| Interquartile Range (IQR) | 3.2% | 16.5% |
| Standard Deviation (Sample) | 3.1% | 21.0% |
| Standard Deviation (Population) | 3.0% | 20.5% |
Similar Demographics by Unemployment Among Youth under 25 years
Demographics Similar to Immigrants from Eastern Europe by Unemployment Among Youth under 25 years
In terms of unemployment among youth under 25 years, the demographic groups most similar to Immigrants from Eastern Europe are American (11.7%, a difference of 0.010%), French American Indian (11.7%, a difference of 0.010%), Maltese (11.7%, a difference of 0.010%), Immigrants from Italy (11.7%, a difference of 0.090%), and Immigrants from Egypt (11.7%, a difference of 0.10%).
| Demographics | Rating | Rank | Unemployment Among Youth under 25 years |
| Immigrants | Denmark | 45.0 /100 | #177 | Average 11.6% |
| Immigrants | Europe | 42.4 /100 | #178 | Average 11.6% |
| Immigrants | Hong Kong | 42.4 /100 | #179 | Average 11.6% |
| Spaniards | 39.8 /100 | #180 | Fair 11.7% |
| Syrians | 38.4 /100 | #181 | Fair 11.7% |
| Immigrants | Italy | 36.2 /100 | #182 | Fair 11.7% |
| Americans | 34.5 /100 | #183 | Fair 11.7% |
| Immigrants | Eastern Europe | 34.1 /100 | #184 | Fair 11.7% |
| French American Indians | 34.0 /100 | #185 | Fair 11.7% |
| Maltese | 33.9 /100 | #186 | Fair 11.7% |
| Immigrants | Egypt | 31.9 /100 | #187 | Fair 11.7% |
| Immigrants | Poland | 31.4 /100 | #188 | Fair 11.7% |
| Japanese | 30.8 /100 | #189 | Fair 11.7% |
| Portuguese | 30.3 /100 | #190 | Fair 11.7% |
| Cypriots | 28.5 /100 | #191 | Fair 11.7% |
Demographics Similar to Canadians by Unemployment Among Youth under 25 years
In terms of unemployment among youth under 25 years, the demographic groups most similar to Canadians are Greek (11.4%, a difference of 0.040%), Italian (11.4%, a difference of 0.050%), Immigrants from Argentina (11.4%, a difference of 0.050%), Immigrants from Hungary (11.4%, a difference of 0.050%), and Turkish (11.4%, a difference of 0.070%).
| Demographics | Rating | Rank | Unemployment Among Youth under 25 years |
| Immigrants | Scotland | 89.2 /100 | #119 | Excellent 11.4% |
| Malaysians | 89.0 /100 | #120 | Excellent 11.4% |
| Slovaks | 88.9 /100 | #121 | Excellent 11.4% |
| Immigrants | Micronesia | 88.1 /100 | #122 | Excellent 11.4% |
| Basques | 87.8 /100 | #123 | Excellent 11.4% |
| Italians | 87.2 /100 | #124 | Excellent 11.4% |
| Immigrants | Argentina | 87.2 /100 | #125 | Excellent 11.4% |
| Canadians | 86.6 /100 | #126 | Excellent 11.4% |
| Greeks | 86.2 /100 | #127 | Excellent 11.4% |
| Immigrants | Hungary | 86.0 /100 | #128 | Excellent 11.4% |
| Turks | 85.8 /100 | #129 | Excellent 11.4% |
| Hungarians | 85.7 /100 | #130 | Excellent 11.4% |
| Immigrants | Spain | 84.6 /100 | #131 | Excellent 11.4% |
| Ethiopians | 83.2 /100 | #132 | Excellent 11.4% |
| Lebanese | 83.1 /100 | #133 | Excellent 11.4% |