Immigrants from Grenada vs New Zealander Unemployment Among Ages 30 to 34 years
COMPARE
Immigrants from Grenada
New Zealander
Unemployment Among Ages 30 to 34 years
Unemployment Among Ages 30 to 34 years Comparison
Immigrants from Grenada
New Zealanders
6.9%
UNEMPLOYMENT AMONG AGES 30 TO 34 YEARS
0.0/ 100
METRIC RATING
309th/ 347
METRIC RANK
5.3%
UNEMPLOYMENT AMONG AGES 30 TO 34 YEARS
82.5/ 100
METRIC RATING
119th/ 347
METRIC RANK
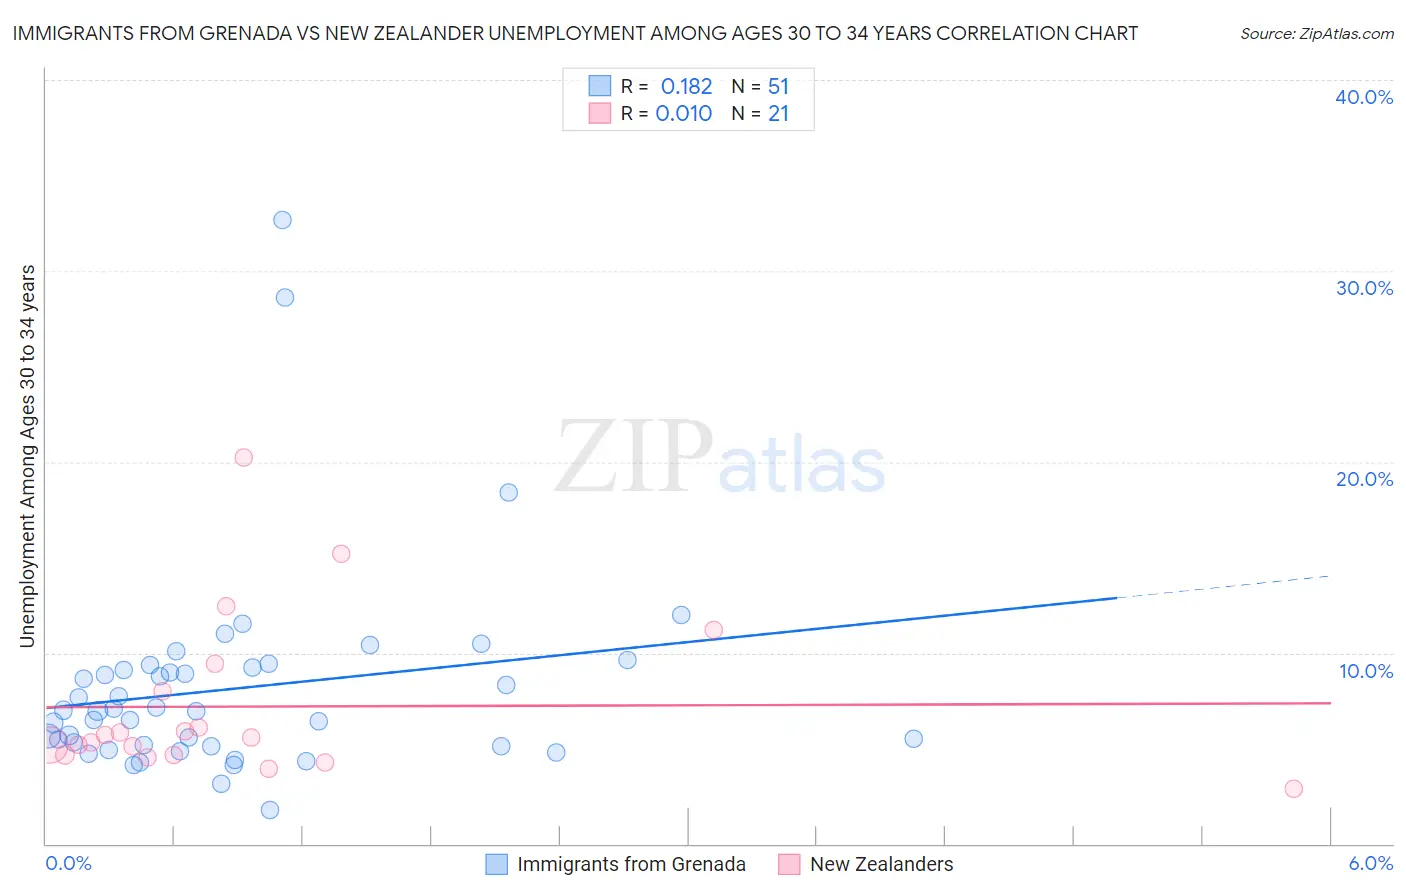
Immigrants from Grenada vs New Zealander Unemployment Among Ages 30 to 34 years Correlation Chart
The statistical analysis conducted on geographies consisting of 66,485,740 people shows a poor positive correlation between the proportion of Immigrants from Grenada and unemployment rate among population between the ages 30 and 34 in the United States with a correlation coefficient (R) of 0.182 and weighted average of 6.9%. Similarly, the statistical analysis conducted on geographies consisting of 104,776,009 people shows no correlation between the proportion of New Zealanders and unemployment rate among population between the ages 30 and 34 in the United States with a correlation coefficient (R) of 0.010 and weighted average of 5.3%, a difference of 30.5%.
Unemployment Among Ages 30 to 34 years Correlation Summary
| Measurement | Immigrants from Grenada | New Zealander |
| Minimum | 1.8% | 2.9% |
| Maximum | 32.7% | 20.2% |
| Range | 30.9% | 17.3% |
| Mean | 8.1% | 7.2% |
| Median | 6.9% | 5.5% |
| Interquartile 25% (IQ1) | 5.1% | 4.6% |
| Interquartile 75% (IQ3) | 9.2% | 8.7% |
| Interquartile Range (IQR) | 4.1% | 4.0% |
| Standard Deviation (Sample) | 5.4% | 4.3% |
| Standard Deviation (Population) | 5.3% | 4.2% |
Similar Demographics by Unemployment Among Ages 30 to 34 years
Demographics Similar to Immigrants from Grenada by Unemployment Among Ages 30 to 34 years
In terms of unemployment among ages 30 to 34 years, the demographic groups most similar to Immigrants from Grenada are Immigrants from St. Vincent and the Grenadines (7.0%, a difference of 0.36%), Immigrants from the Azores (6.9%, a difference of 0.68%), Immigrants from Belize (6.9%, a difference of 1.1%), Immigrants from Armenia (6.8%, a difference of 1.3%), and Alaskan Athabascan (7.0%, a difference of 1.4%).
| Demographics | Rating | Rank | Unemployment Among Ages 30 to 34 years |
| Delaware | 0.0 /100 | #302 | Tragic 6.7% |
| Cajuns | 0.0 /100 | #303 | Tragic 6.7% |
| Kiowa | 0.0 /100 | #304 | Tragic 6.7% |
| Paiute | 0.0 /100 | #305 | Tragic 6.7% |
| Immigrants | Armenia | 0.0 /100 | #306 | Tragic 6.8% |
| Immigrants | Belize | 0.0 /100 | #307 | Tragic 6.9% |
| Immigrants | Azores | 0.0 /100 | #308 | Tragic 6.9% |
| Immigrants | Grenada | 0.0 /100 | #309 | Tragic 6.9% |
| Immigrants | St. Vincent and the Grenadines | 0.0 /100 | #310 | Tragic 7.0% |
| Alaskan Athabascans | 0.0 /100 | #311 | Tragic 7.0% |
| British West Indians | 0.0 /100 | #312 | Tragic 7.0% |
| Ute | 0.0 /100 | #313 | Tragic 7.0% |
| Lumbee | 0.0 /100 | #314 | Tragic 7.1% |
| Aleuts | 0.0 /100 | #315 | Tragic 7.1% |
| Houma | 0.0 /100 | #316 | Tragic 7.2% |
Demographics Similar to New Zealanders by Unemployment Among Ages 30 to 34 years
In terms of unemployment among ages 30 to 34 years, the demographic groups most similar to New Zealanders are Immigrants from Poland (5.3%, a difference of 0.010%), Romanian (5.3%, a difference of 0.030%), Immigrants from South Africa (5.3%, a difference of 0.060%), Australian (5.3%, a difference of 0.070%), and Eastern European (5.3%, a difference of 0.080%).
| Demographics | Rating | Rank | Unemployment Among Ages 30 to 34 years |
| Swiss | 85.9 /100 | #112 | Excellent 5.3% |
| Immigrants | Spain | 85.6 /100 | #113 | Excellent 5.3% |
| Estonians | 83.7 /100 | #114 | Excellent 5.3% |
| Immigrants | Albania | 83.4 /100 | #115 | Excellent 5.3% |
| Eastern Europeans | 83.2 /100 | #116 | Excellent 5.3% |
| Australians | 83.1 /100 | #117 | Excellent 5.3% |
| Immigrants | South Africa | 83.0 /100 | #118 | Excellent 5.3% |
| New Zealanders | 82.5 /100 | #119 | Excellent 5.3% |
| Immigrants | Poland | 82.4 /100 | #120 | Excellent 5.3% |
| Romanians | 82.3 /100 | #121 | Excellent 5.3% |
| Immigrants | Netherlands | 81.8 /100 | #122 | Excellent 5.3% |
| Immigrants | Italy | 81.1 /100 | #123 | Excellent 5.3% |
| Immigrants | Brazil | 80.8 /100 | #124 | Excellent 5.3% |
| Greeks | 80.4 /100 | #125 | Excellent 5.3% |
| Immigrants | Sri Lanka | 80.2 /100 | #126 | Excellent 5.3% |