Immigrants from Grenada vs Cheyenne Unemployment Among Ages 30 to 34 years
COMPARE
Immigrants from Grenada
Cheyenne
Unemployment Among Ages 30 to 34 years
Unemployment Among Ages 30 to 34 years Comparison
Immigrants from Grenada
Cheyenne
6.9%
UNEMPLOYMENT AMONG AGES 30 TO 34 YEARS
0.0/ 100
METRIC RATING
309th/ 347
METRIC RANK
7.8%
UNEMPLOYMENT AMONG AGES 30 TO 34 YEARS
0.0/ 100
METRIC RATING
329th/ 347
METRIC RANK
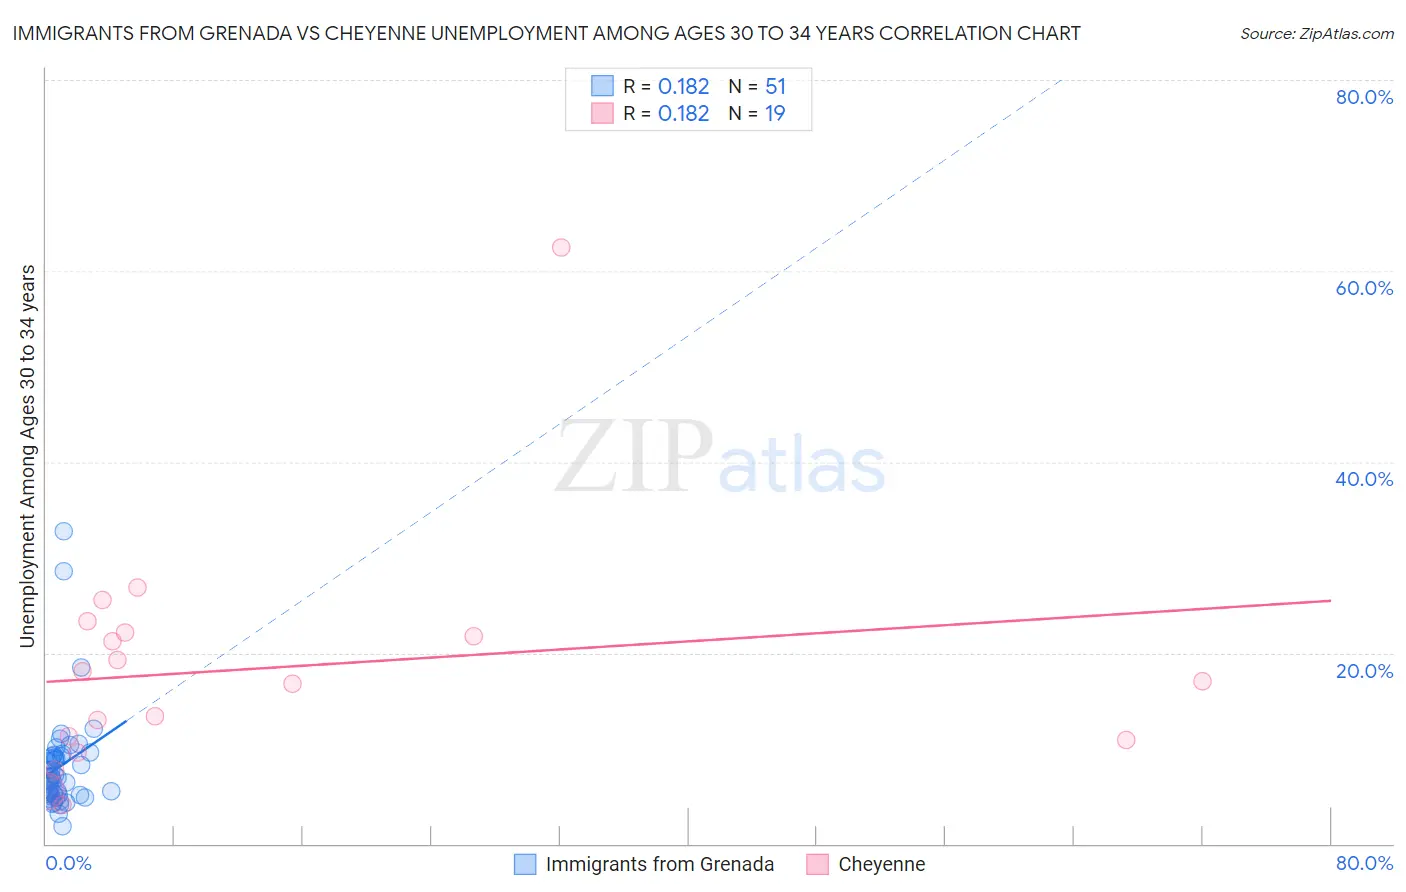
Immigrants from Grenada vs Cheyenne Unemployment Among Ages 30 to 34 years Correlation Chart
The statistical analysis conducted on geographies consisting of 66,485,740 people shows a poor positive correlation between the proportion of Immigrants from Grenada and unemployment rate among population between the ages 30 and 34 in the United States with a correlation coefficient (R) of 0.182 and weighted average of 6.9%. Similarly, the statistical analysis conducted on geographies consisting of 79,251,794 people shows a poor positive correlation between the proportion of Cheyenne and unemployment rate among population between the ages 30 and 34 in the United States with a correlation coefficient (R) of 0.182 and weighted average of 7.8%, a difference of 13.1%.
Unemployment Among Ages 30 to 34 years Correlation Summary
| Measurement | Immigrants from Grenada | Cheyenne |
| Minimum | 1.8% | 4.0% |
| Maximum | 32.7% | 62.5% |
| Range | 30.9% | 58.5% |
| Mean | 8.1% | 18.4% |
| Median | 6.9% | 17.0% |
| Interquartile 25% (IQ1) | 5.1% | 10.9% |
| Interquartile 75% (IQ3) | 9.2% | 22.1% |
| Interquartile Range (IQR) | 4.1% | 11.2% |
| Standard Deviation (Sample) | 5.4% | 12.6% |
| Standard Deviation (Population) | 5.3% | 12.3% |
Demographics Similar to Immigrants from Grenada and Cheyenne by Unemployment Among Ages 30 to 34 years
In terms of unemployment among ages 30 to 34 years, the demographic groups most similar to Immigrants from Grenada are Immigrants from St. Vincent and the Grenadines (7.0%, a difference of 0.36%), Alaskan Athabascan (7.0%, a difference of 1.4%), British West Indian (7.0%, a difference of 1.5%), Ute (7.0%, a difference of 1.5%), and Lumbee (7.1%, a difference of 1.8%). Similarly, the demographic groups most similar to Cheyenne are Chippewa (7.8%, a difference of 1.1%), Immigrants from Dominican Republic (7.7%, a difference of 1.3%), Dominican (7.7%, a difference of 2.1%), Apache (7.3%, a difference of 6.8%), and Immigrants from Dominica (7.3%, a difference of 7.1%).
| Demographics | Rating | Rank | Unemployment Among Ages 30 to 34 years |
| Immigrants | Grenada | 0.0 /100 | #309 | Tragic 6.9% |
| Immigrants | St. Vincent and the Grenadines | 0.0 /100 | #310 | Tragic 7.0% |
| Alaskan Athabascans | 0.0 /100 | #311 | Tragic 7.0% |
| British West Indians | 0.0 /100 | #312 | Tragic 7.0% |
| Ute | 0.0 /100 | #313 | Tragic 7.0% |
| Lumbee | 0.0 /100 | #314 | Tragic 7.1% |
| Aleuts | 0.0 /100 | #315 | Tragic 7.1% |
| Houma | 0.0 /100 | #316 | Tragic 7.2% |
| Immigrants | Cabo Verde | 0.0 /100 | #317 | Tragic 7.2% |
| Blacks/African Americans | 0.0 /100 | #318 | Tragic 7.2% |
| Guyanese | 0.0 /100 | #319 | Tragic 7.2% |
| Cape Verdeans | 0.0 /100 | #320 | Tragic 7.2% |
| Immigrants | Guyana | 0.0 /100 | #321 | Tragic 7.2% |
| Marshallese | 0.0 /100 | #322 | Tragic 7.2% |
| Immigrants | Yemen | 0.0 /100 | #323 | Tragic 7.3% |
| Immigrants | Dominica | 0.0 /100 | #324 | Tragic 7.3% |
| Apache | 0.0 /100 | #325 | Tragic 7.3% |
| Dominicans | 0.0 /100 | #326 | Tragic 7.7% |
| Immigrants | Dominican Republic | 0.0 /100 | #327 | Tragic 7.7% |
| Chippewa | 0.0 /100 | #328 | Tragic 7.8% |
| Cheyenne | 0.0 /100 | #329 | Tragic 7.8% |